How to Transform Data Using Helio Extension
Another form of transforming data in Workhelio is with the use of helio extension. This extension is available in Chrome. You can download it here here.

Steps to Use Helio Extension to Transform Data
The following steps will help you use the helio extension to transform your data:
Open the Extension
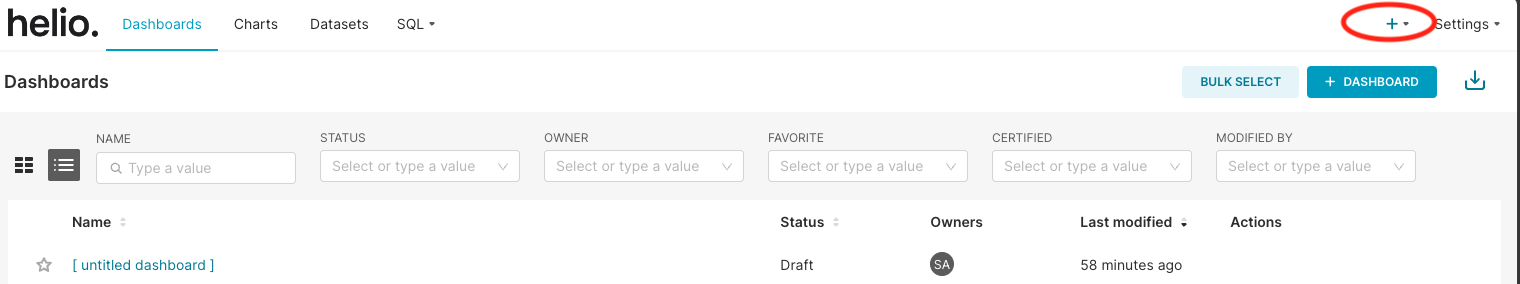
Once you are done downloading the helio extension, open it to start using it. You can pin it at the top of your browser. When you open it, it looks like this:

Create a Dashboard
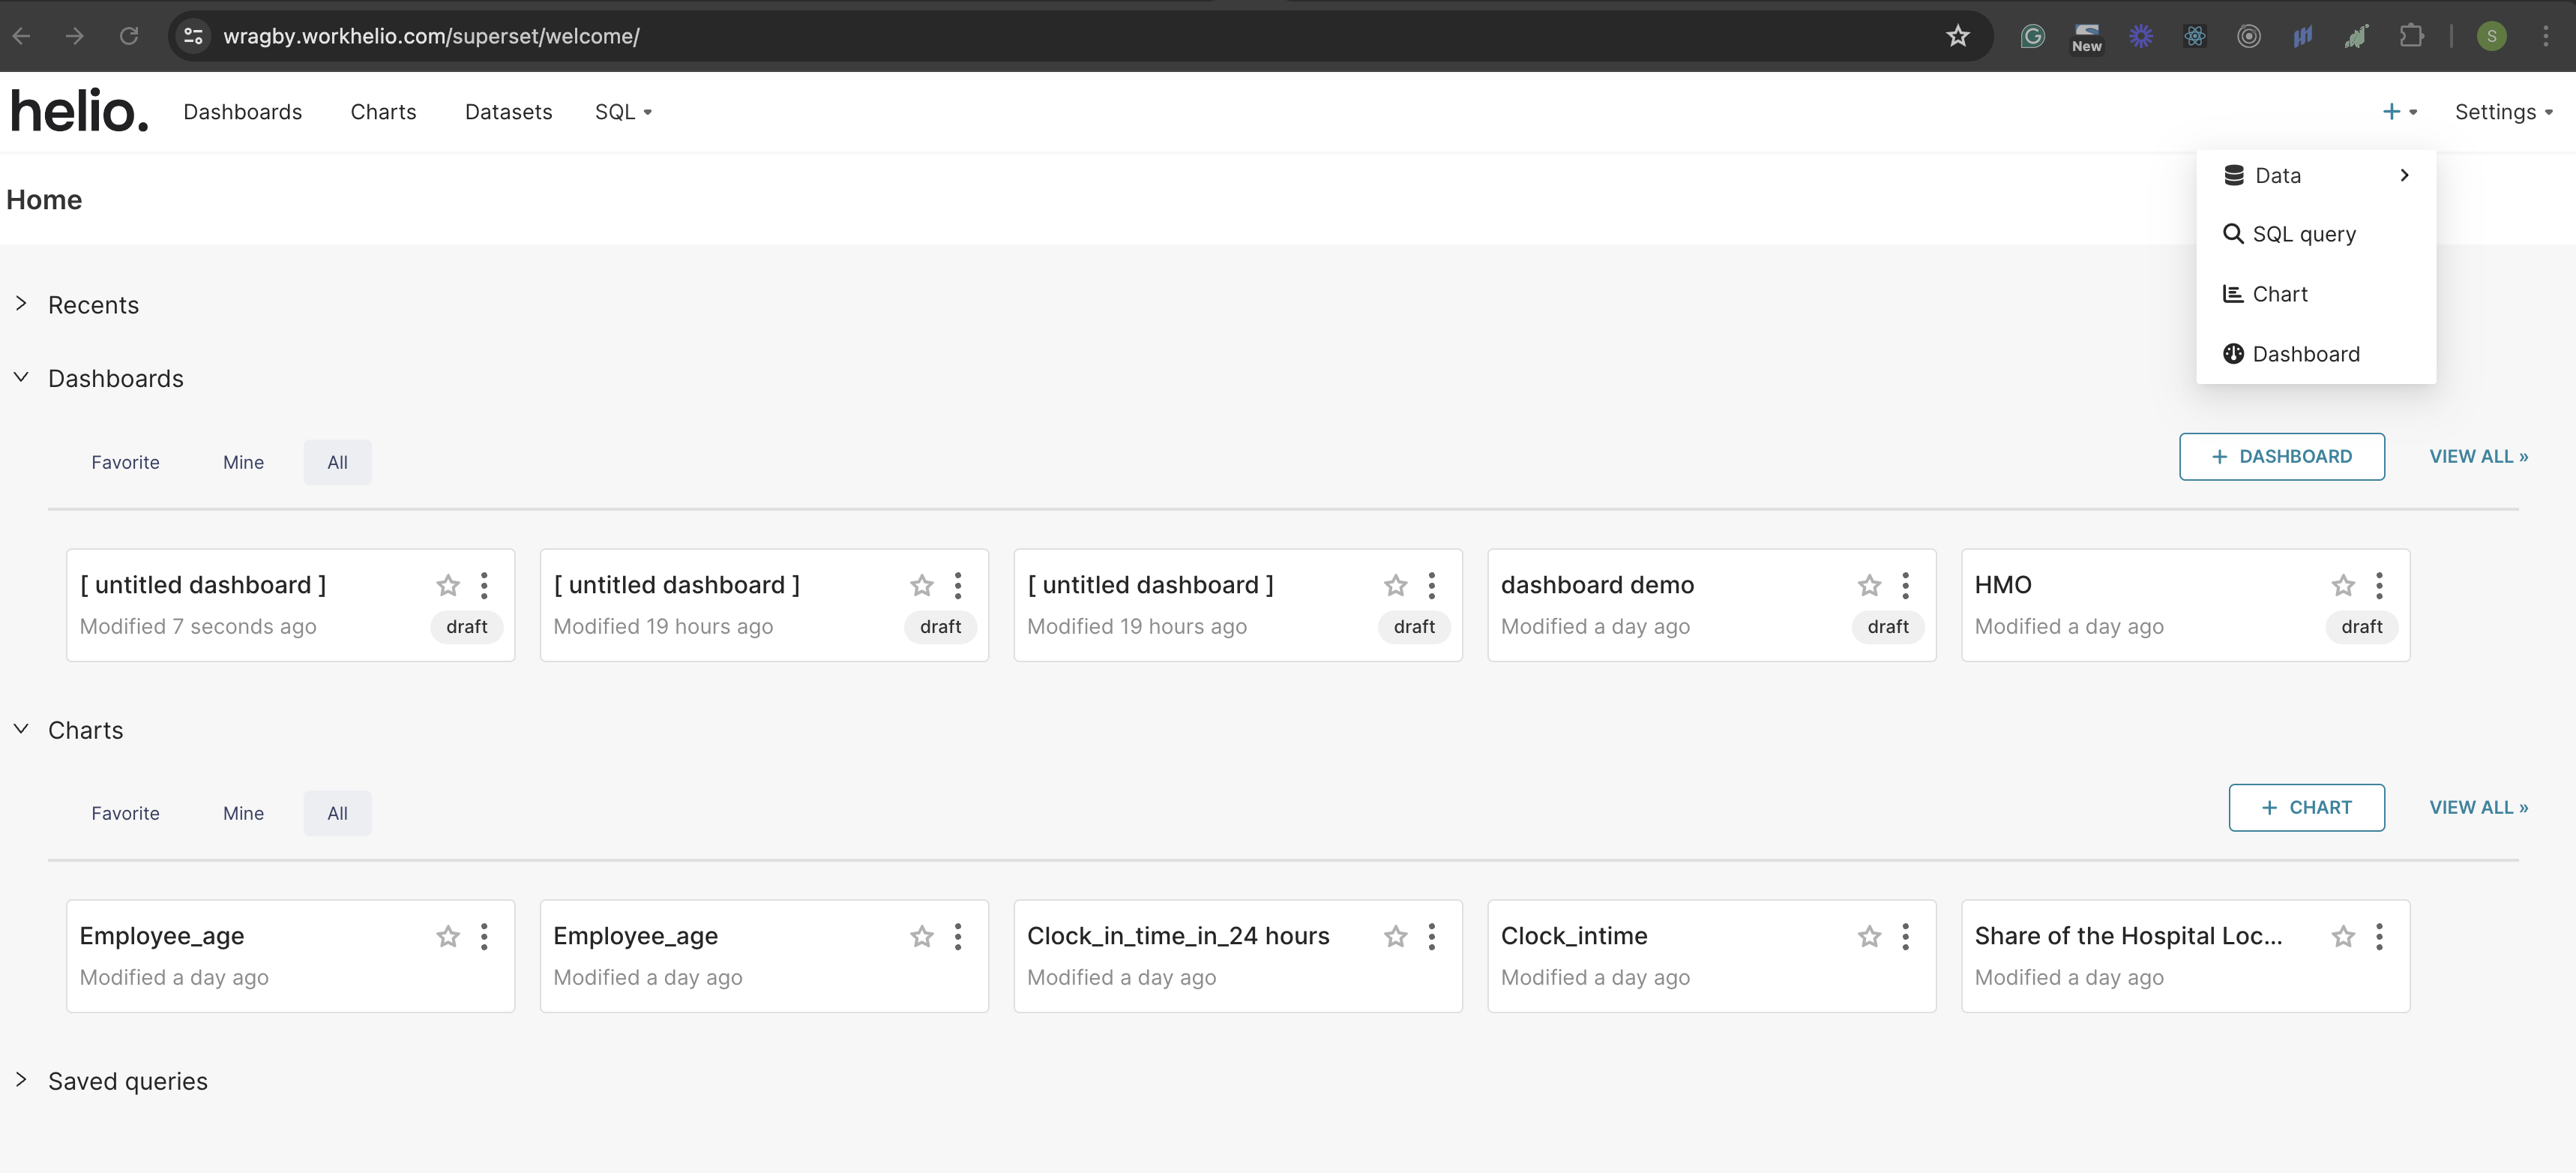
Click on the plus (+) button on the top right of the screen to create a dashboard.
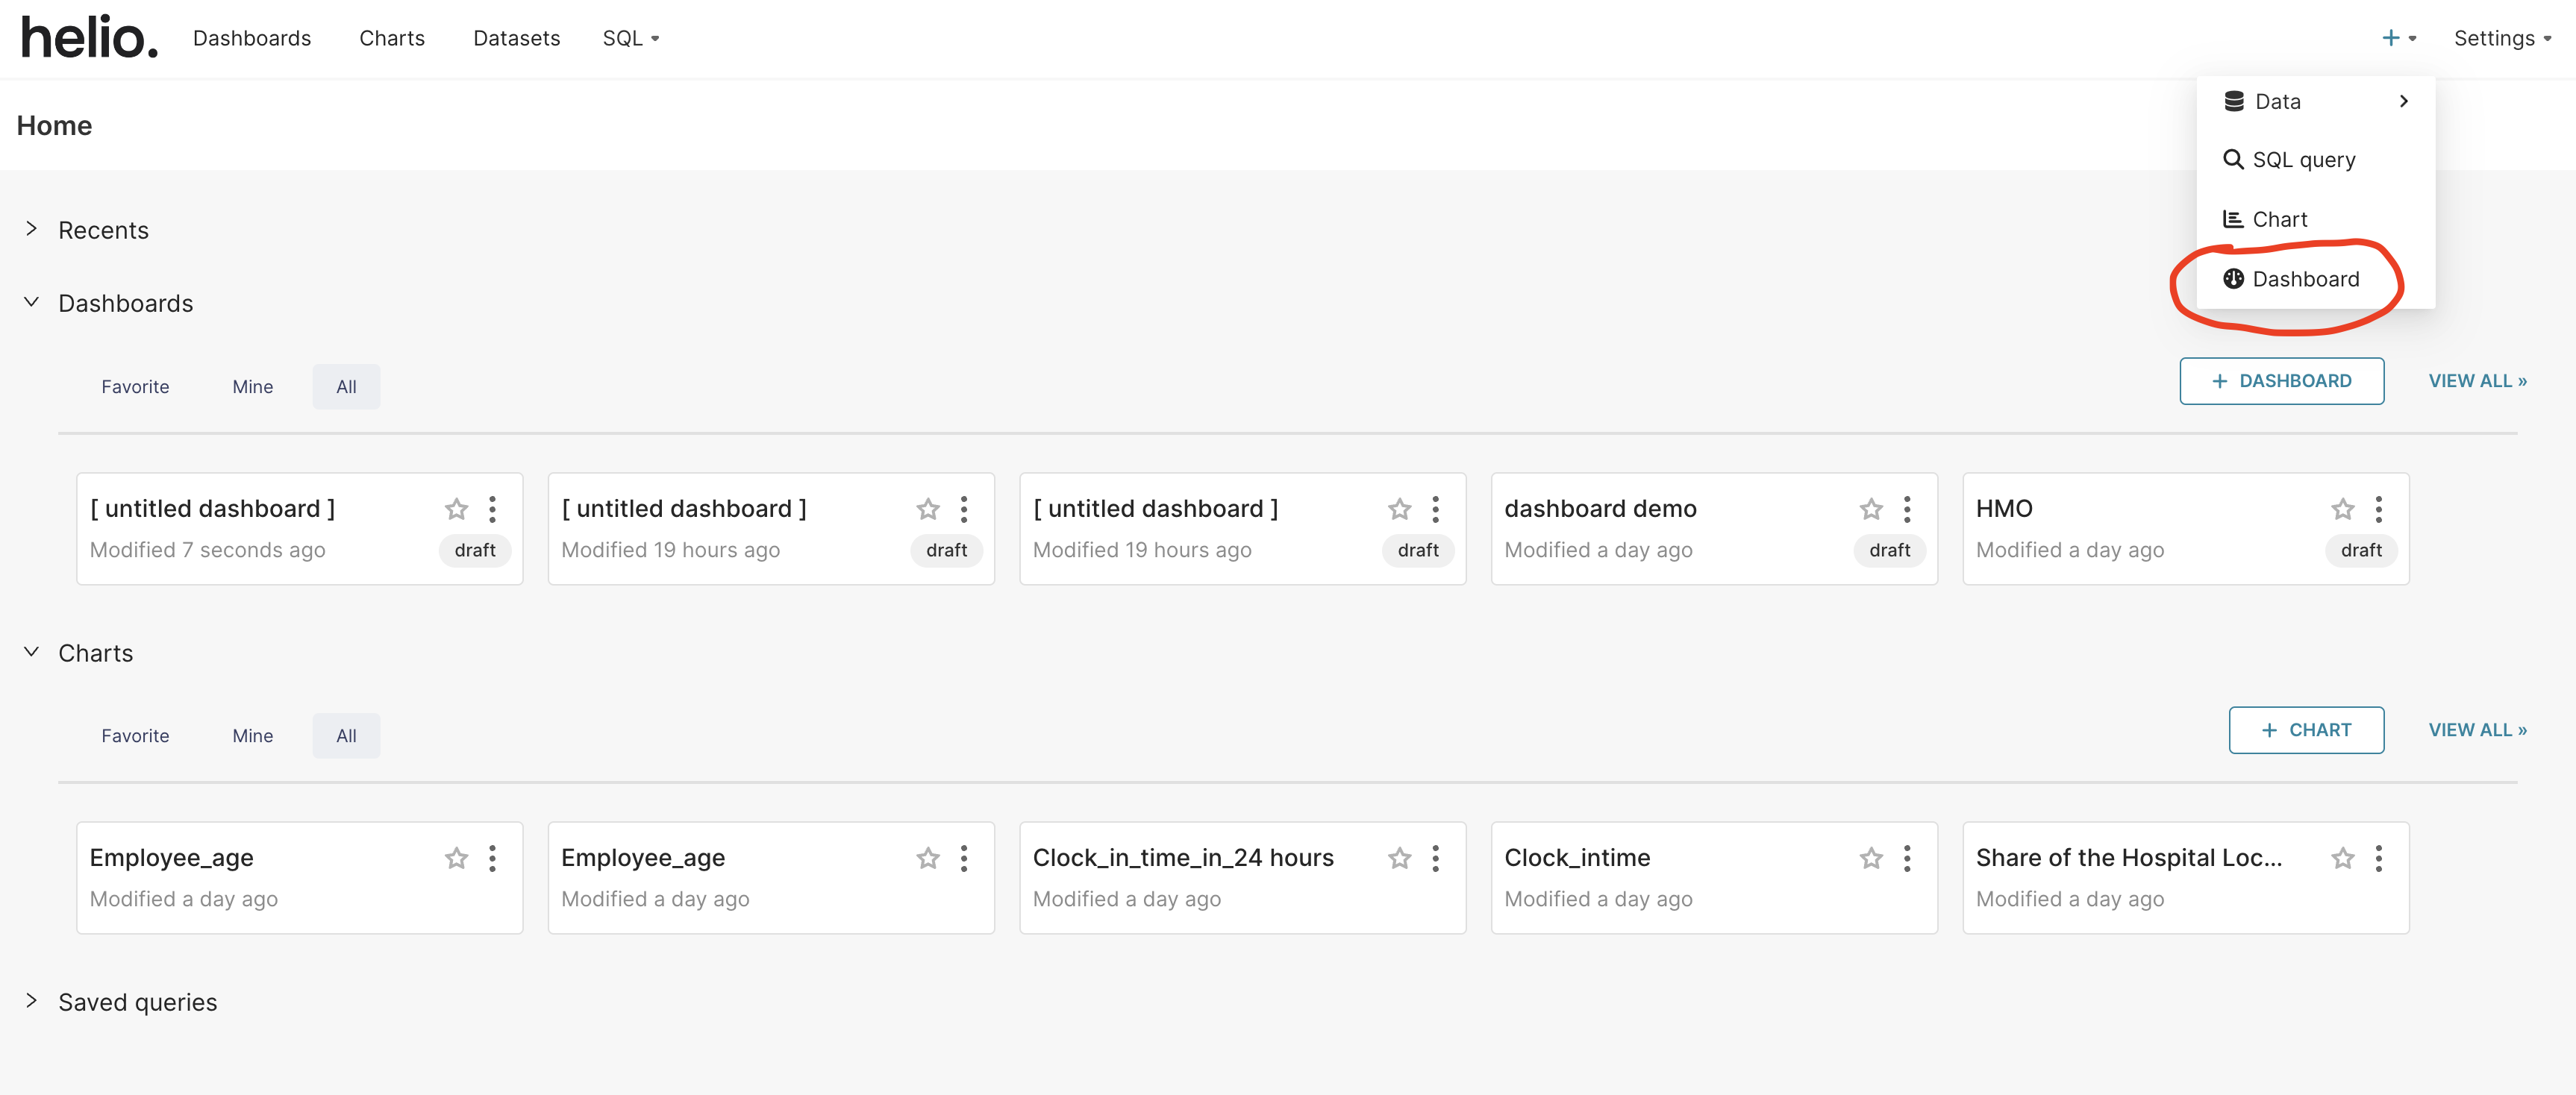
Select the “Dashboard” option inside the modal that appears after clicking the plus button.
Name Your Dashboard
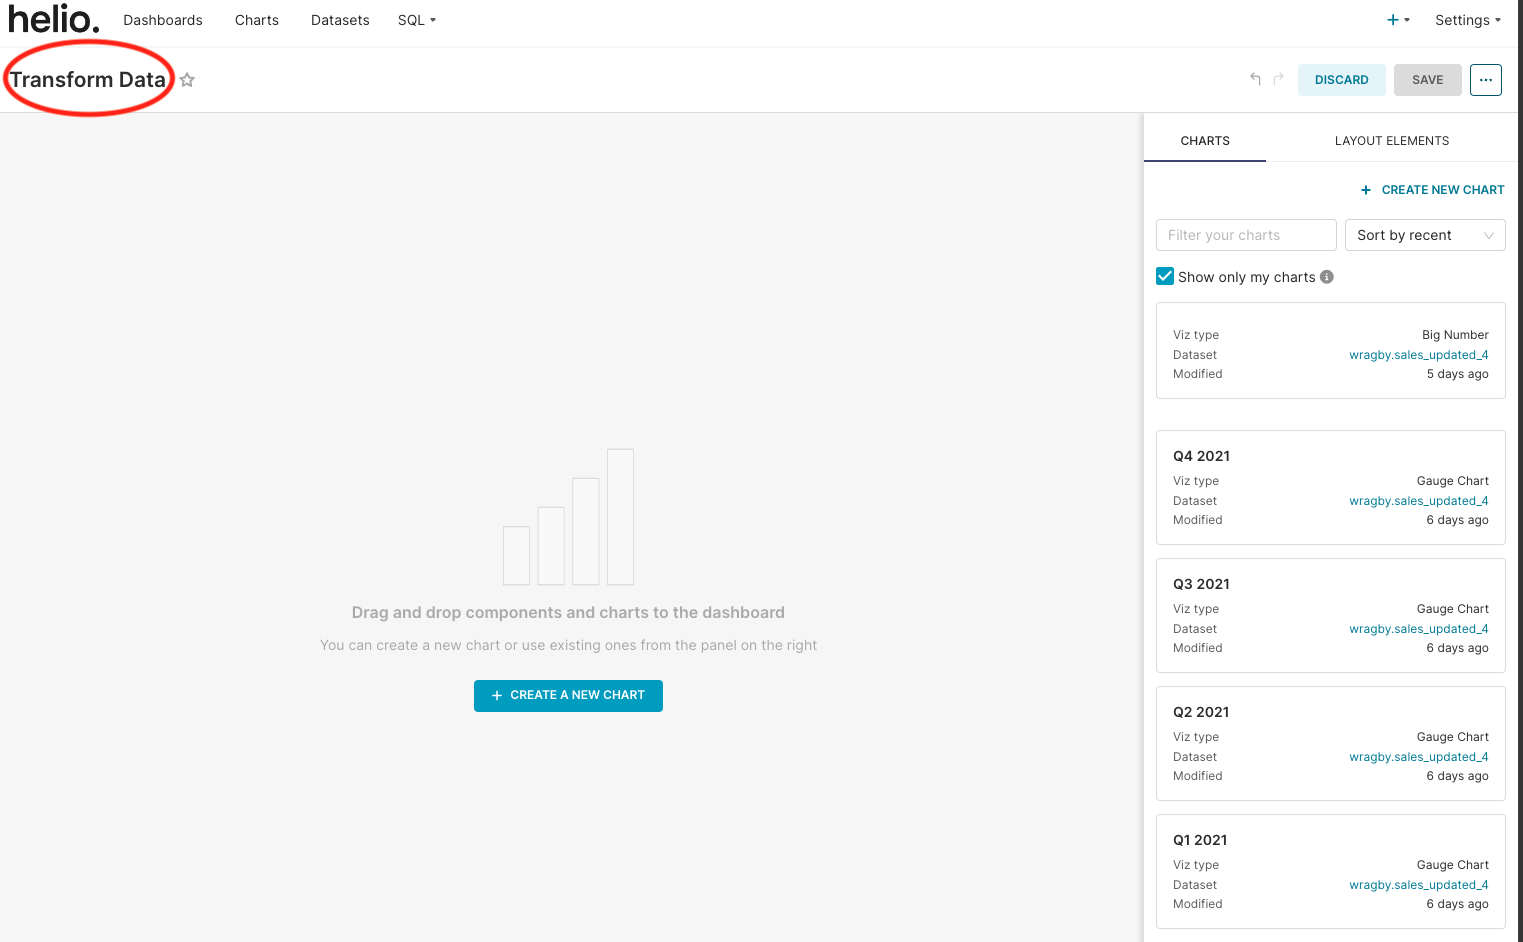
After selecting the dashboard, you will be taken to the dashboard page. On the top-left of the screen, edit the title of your dashboard to the title of your choice.
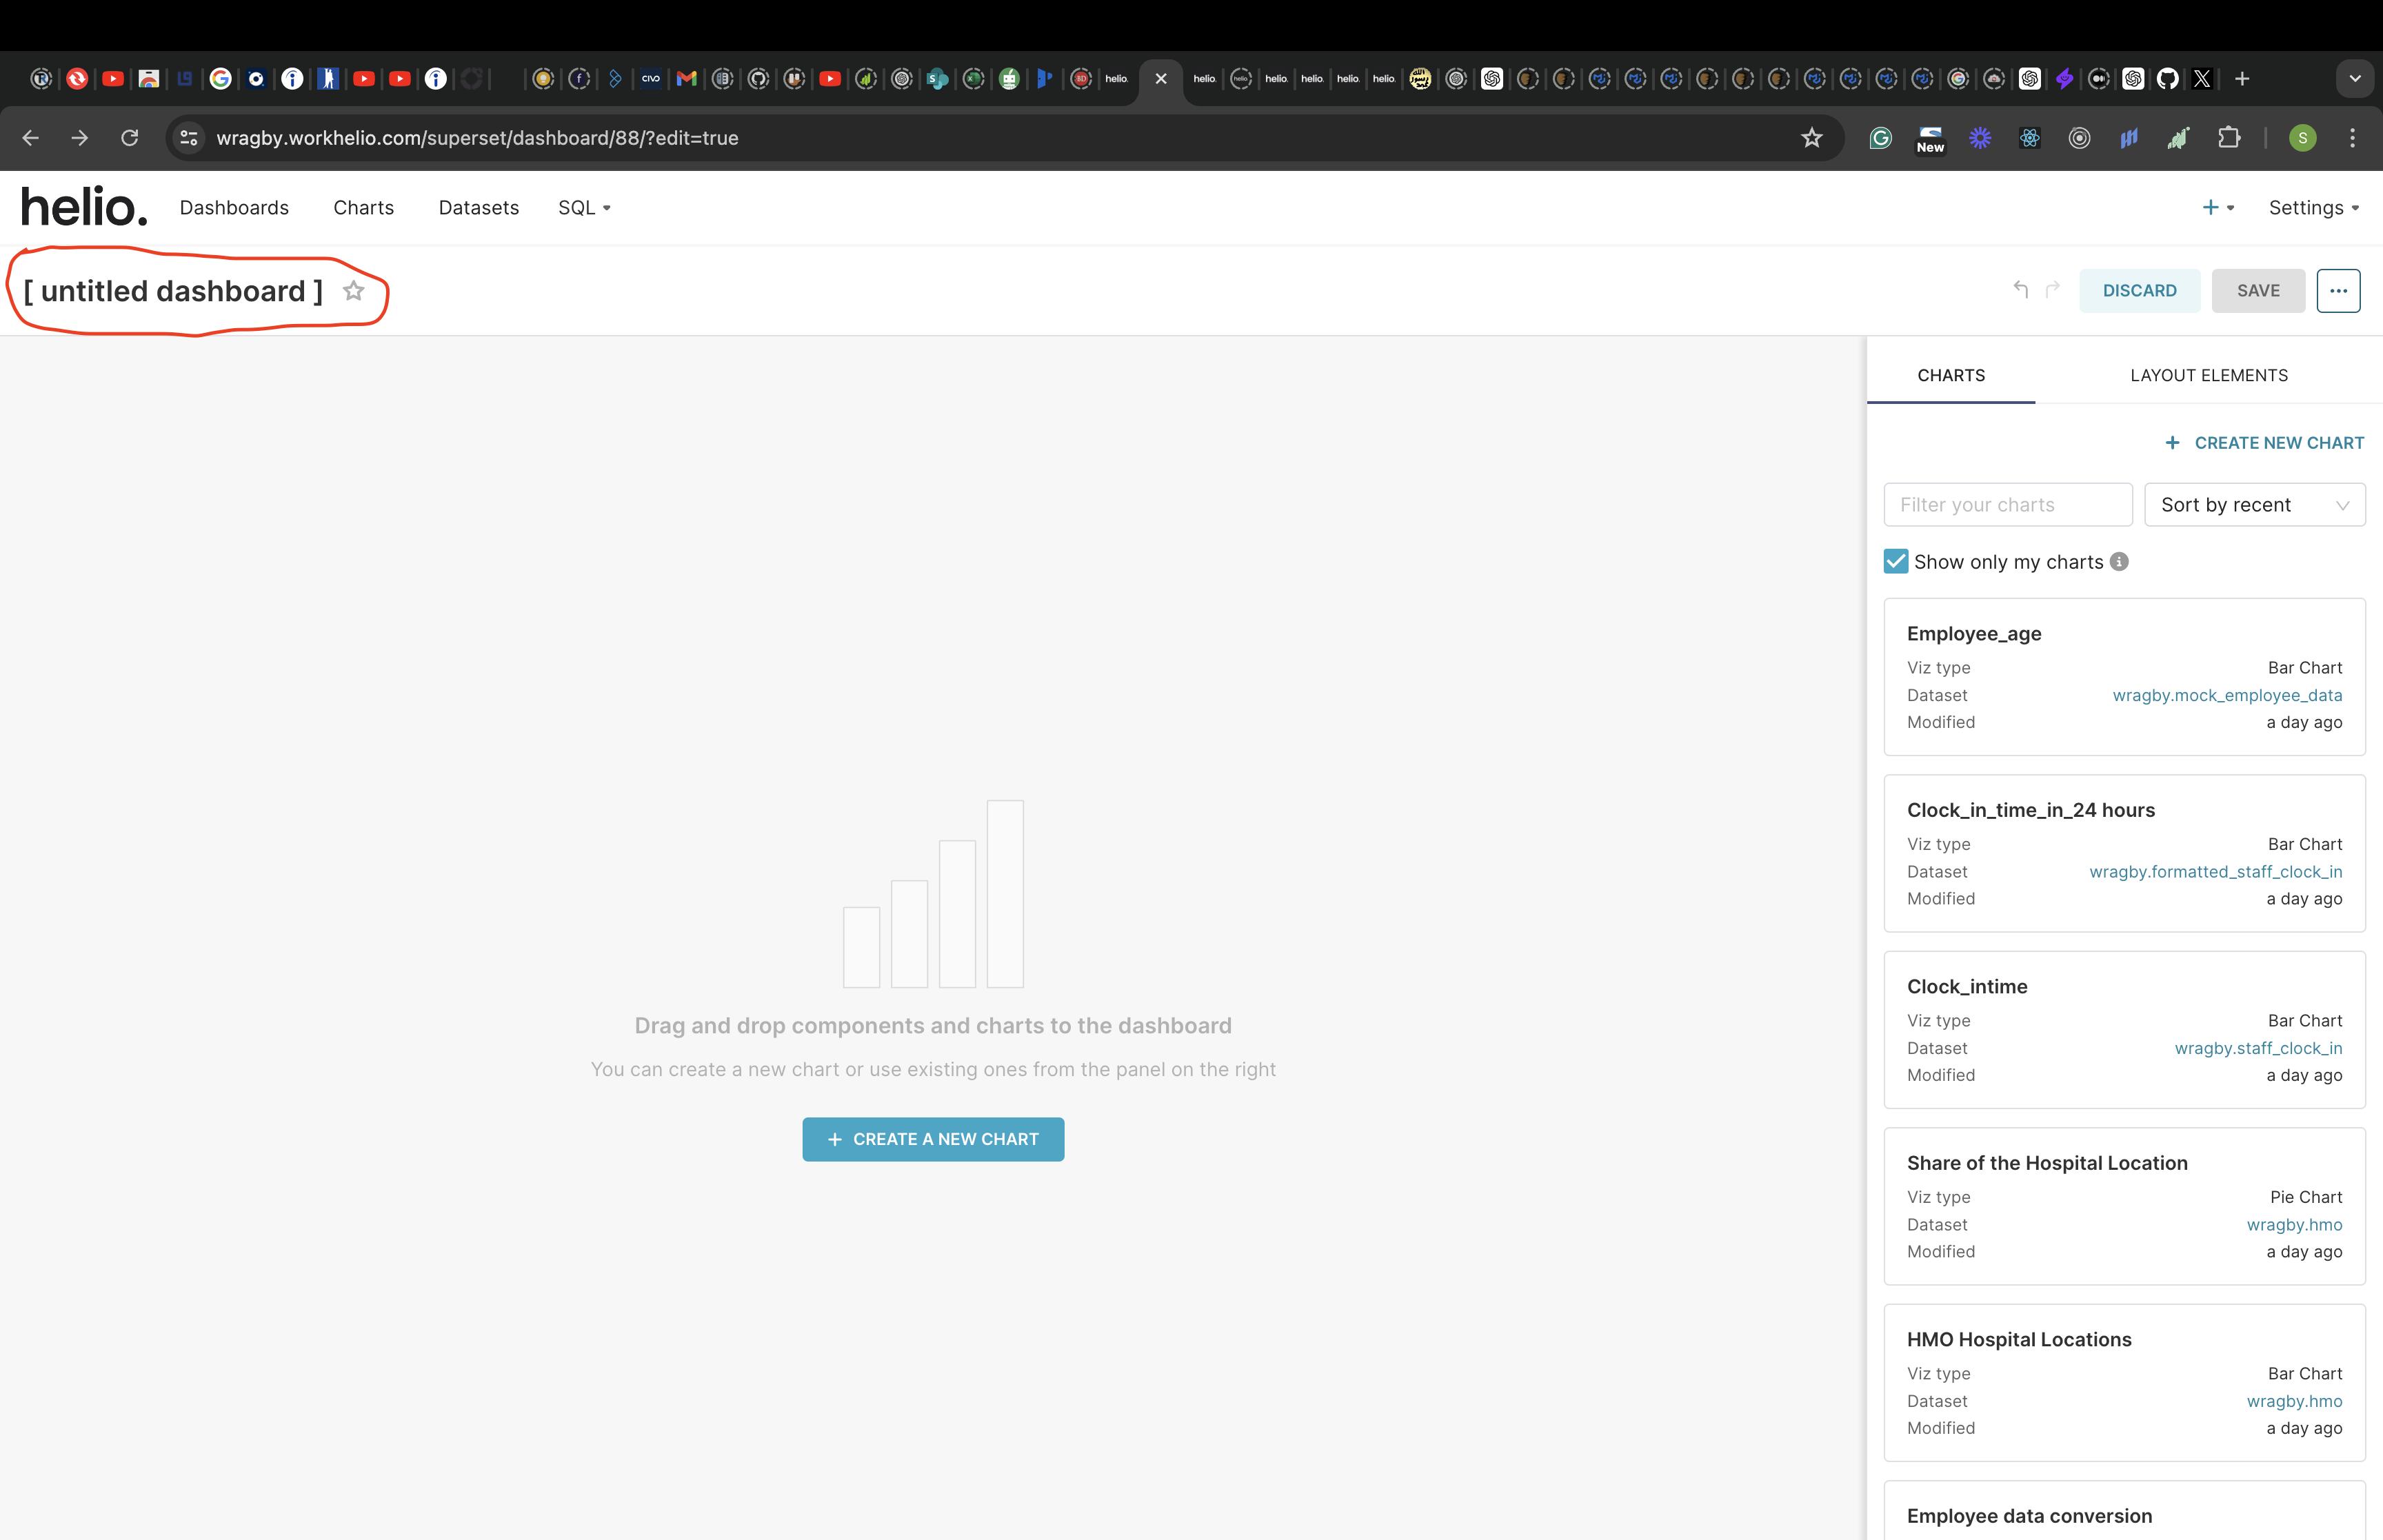
Let’s name our dashboard “Transform Data”. Click the save button on the top-right of the screen to save the title.
Edit the Dashboard to Create a New Chart
After saving the dashboard name, click the edit dashboard button to create a new chart.
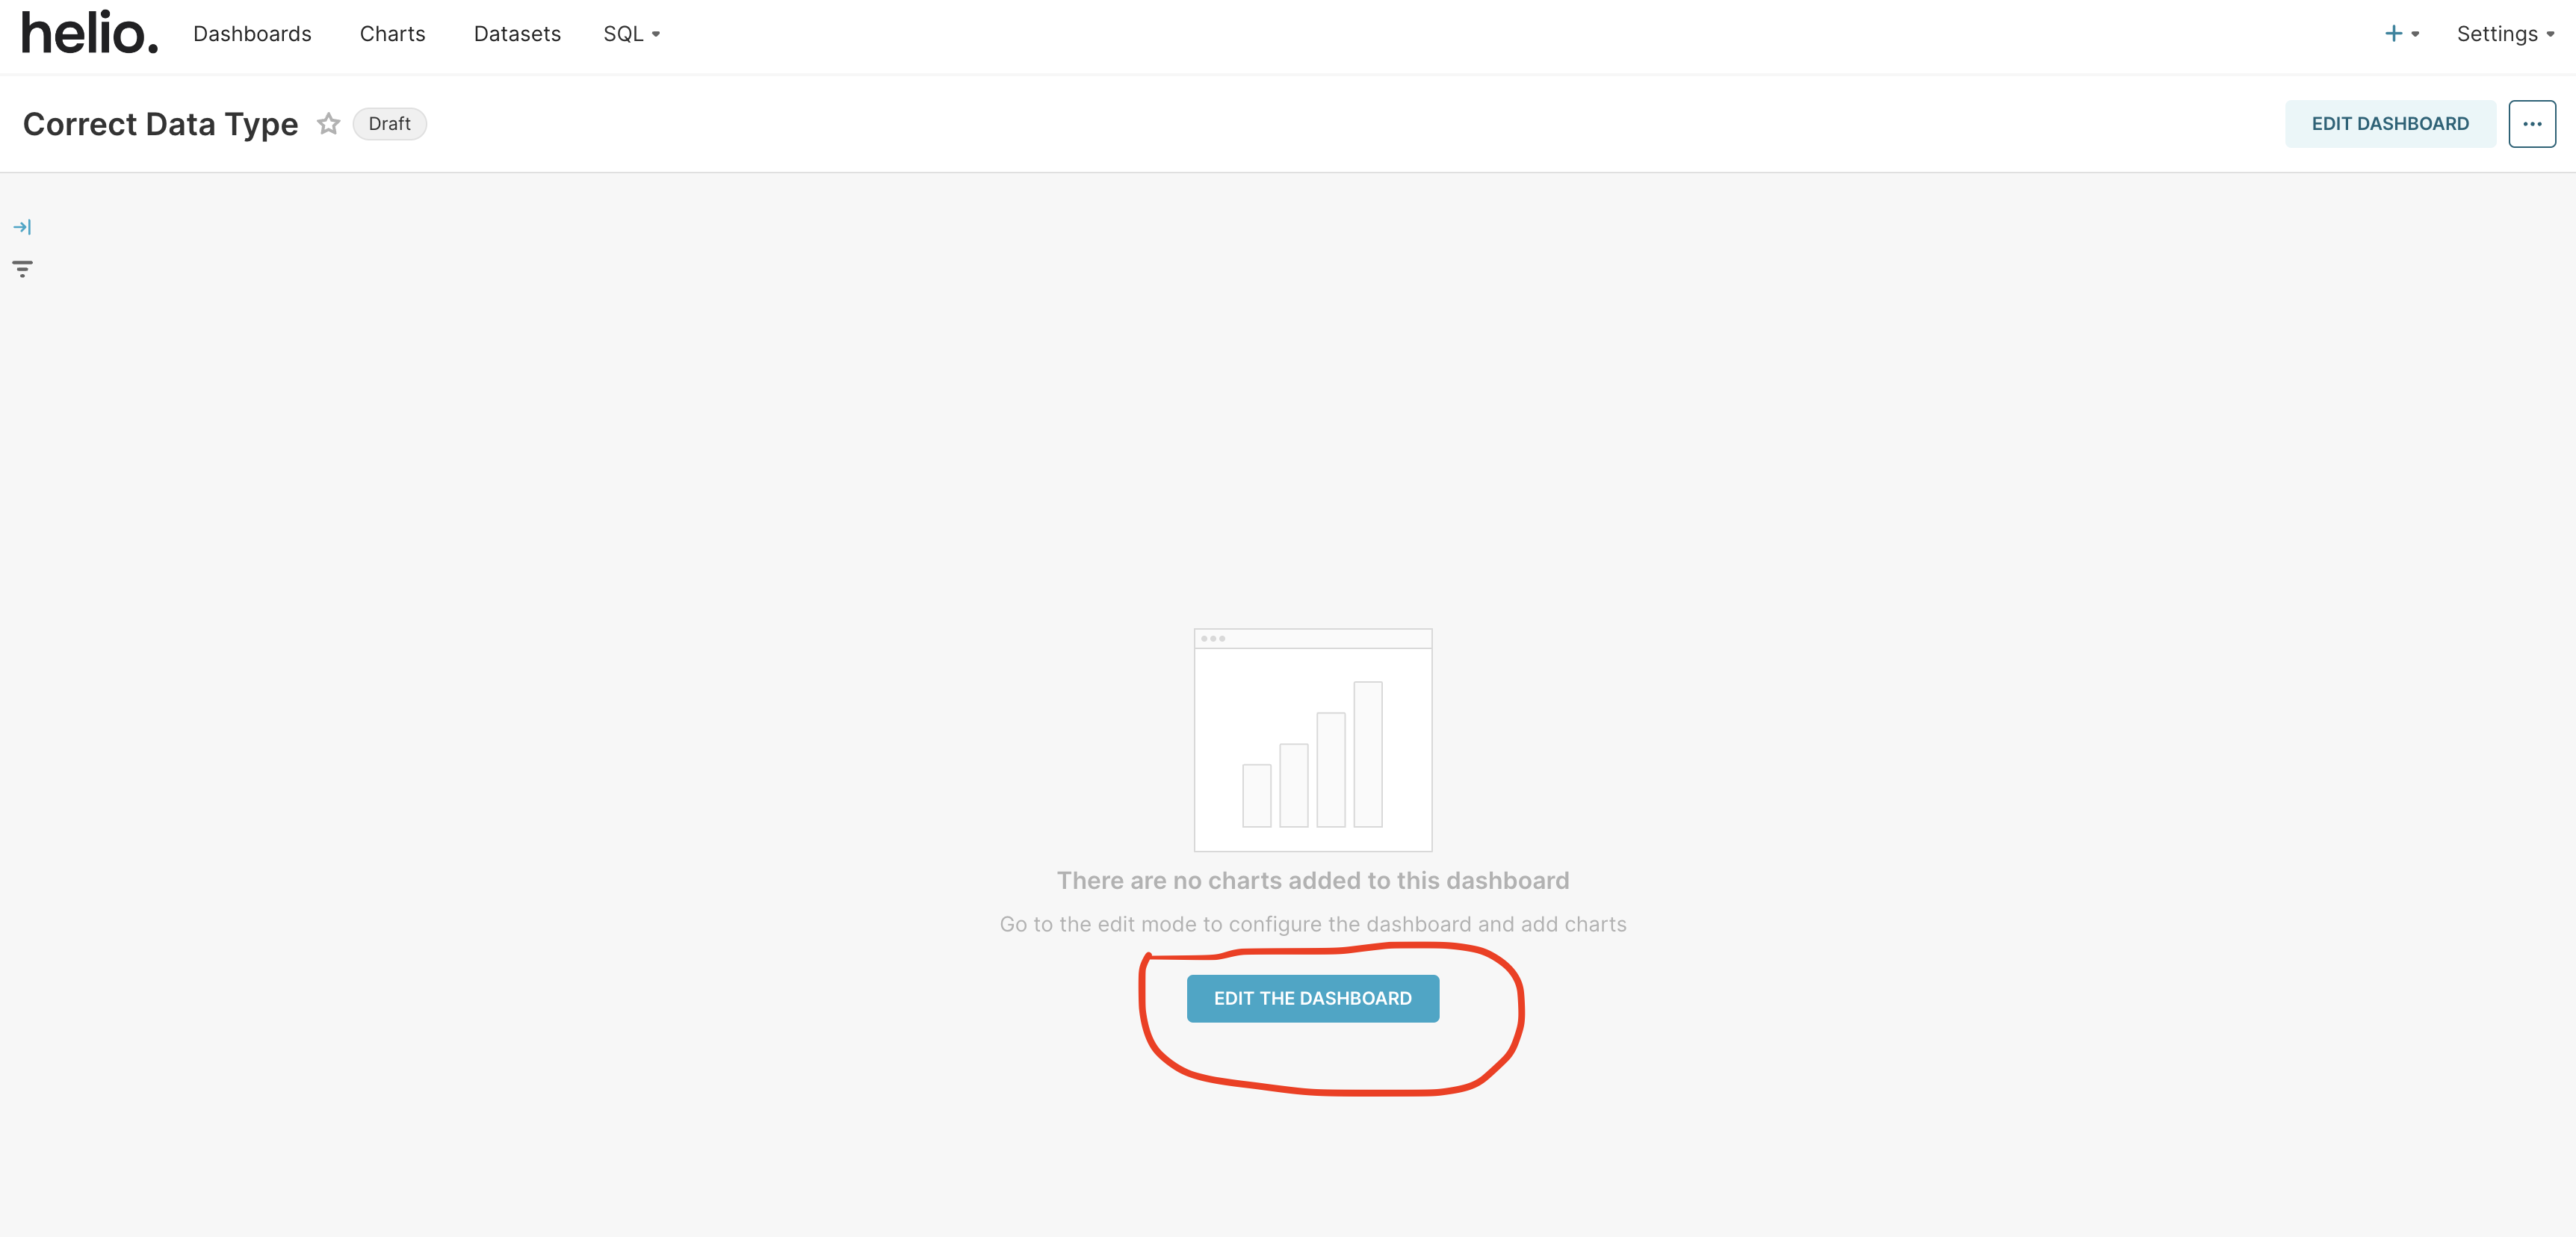
The page will change and you will see a new button - “CREATE A NEW CHART”, click on it.

This will take you to a new page where you will select the chart type you want and build your preferred dashboard chart.
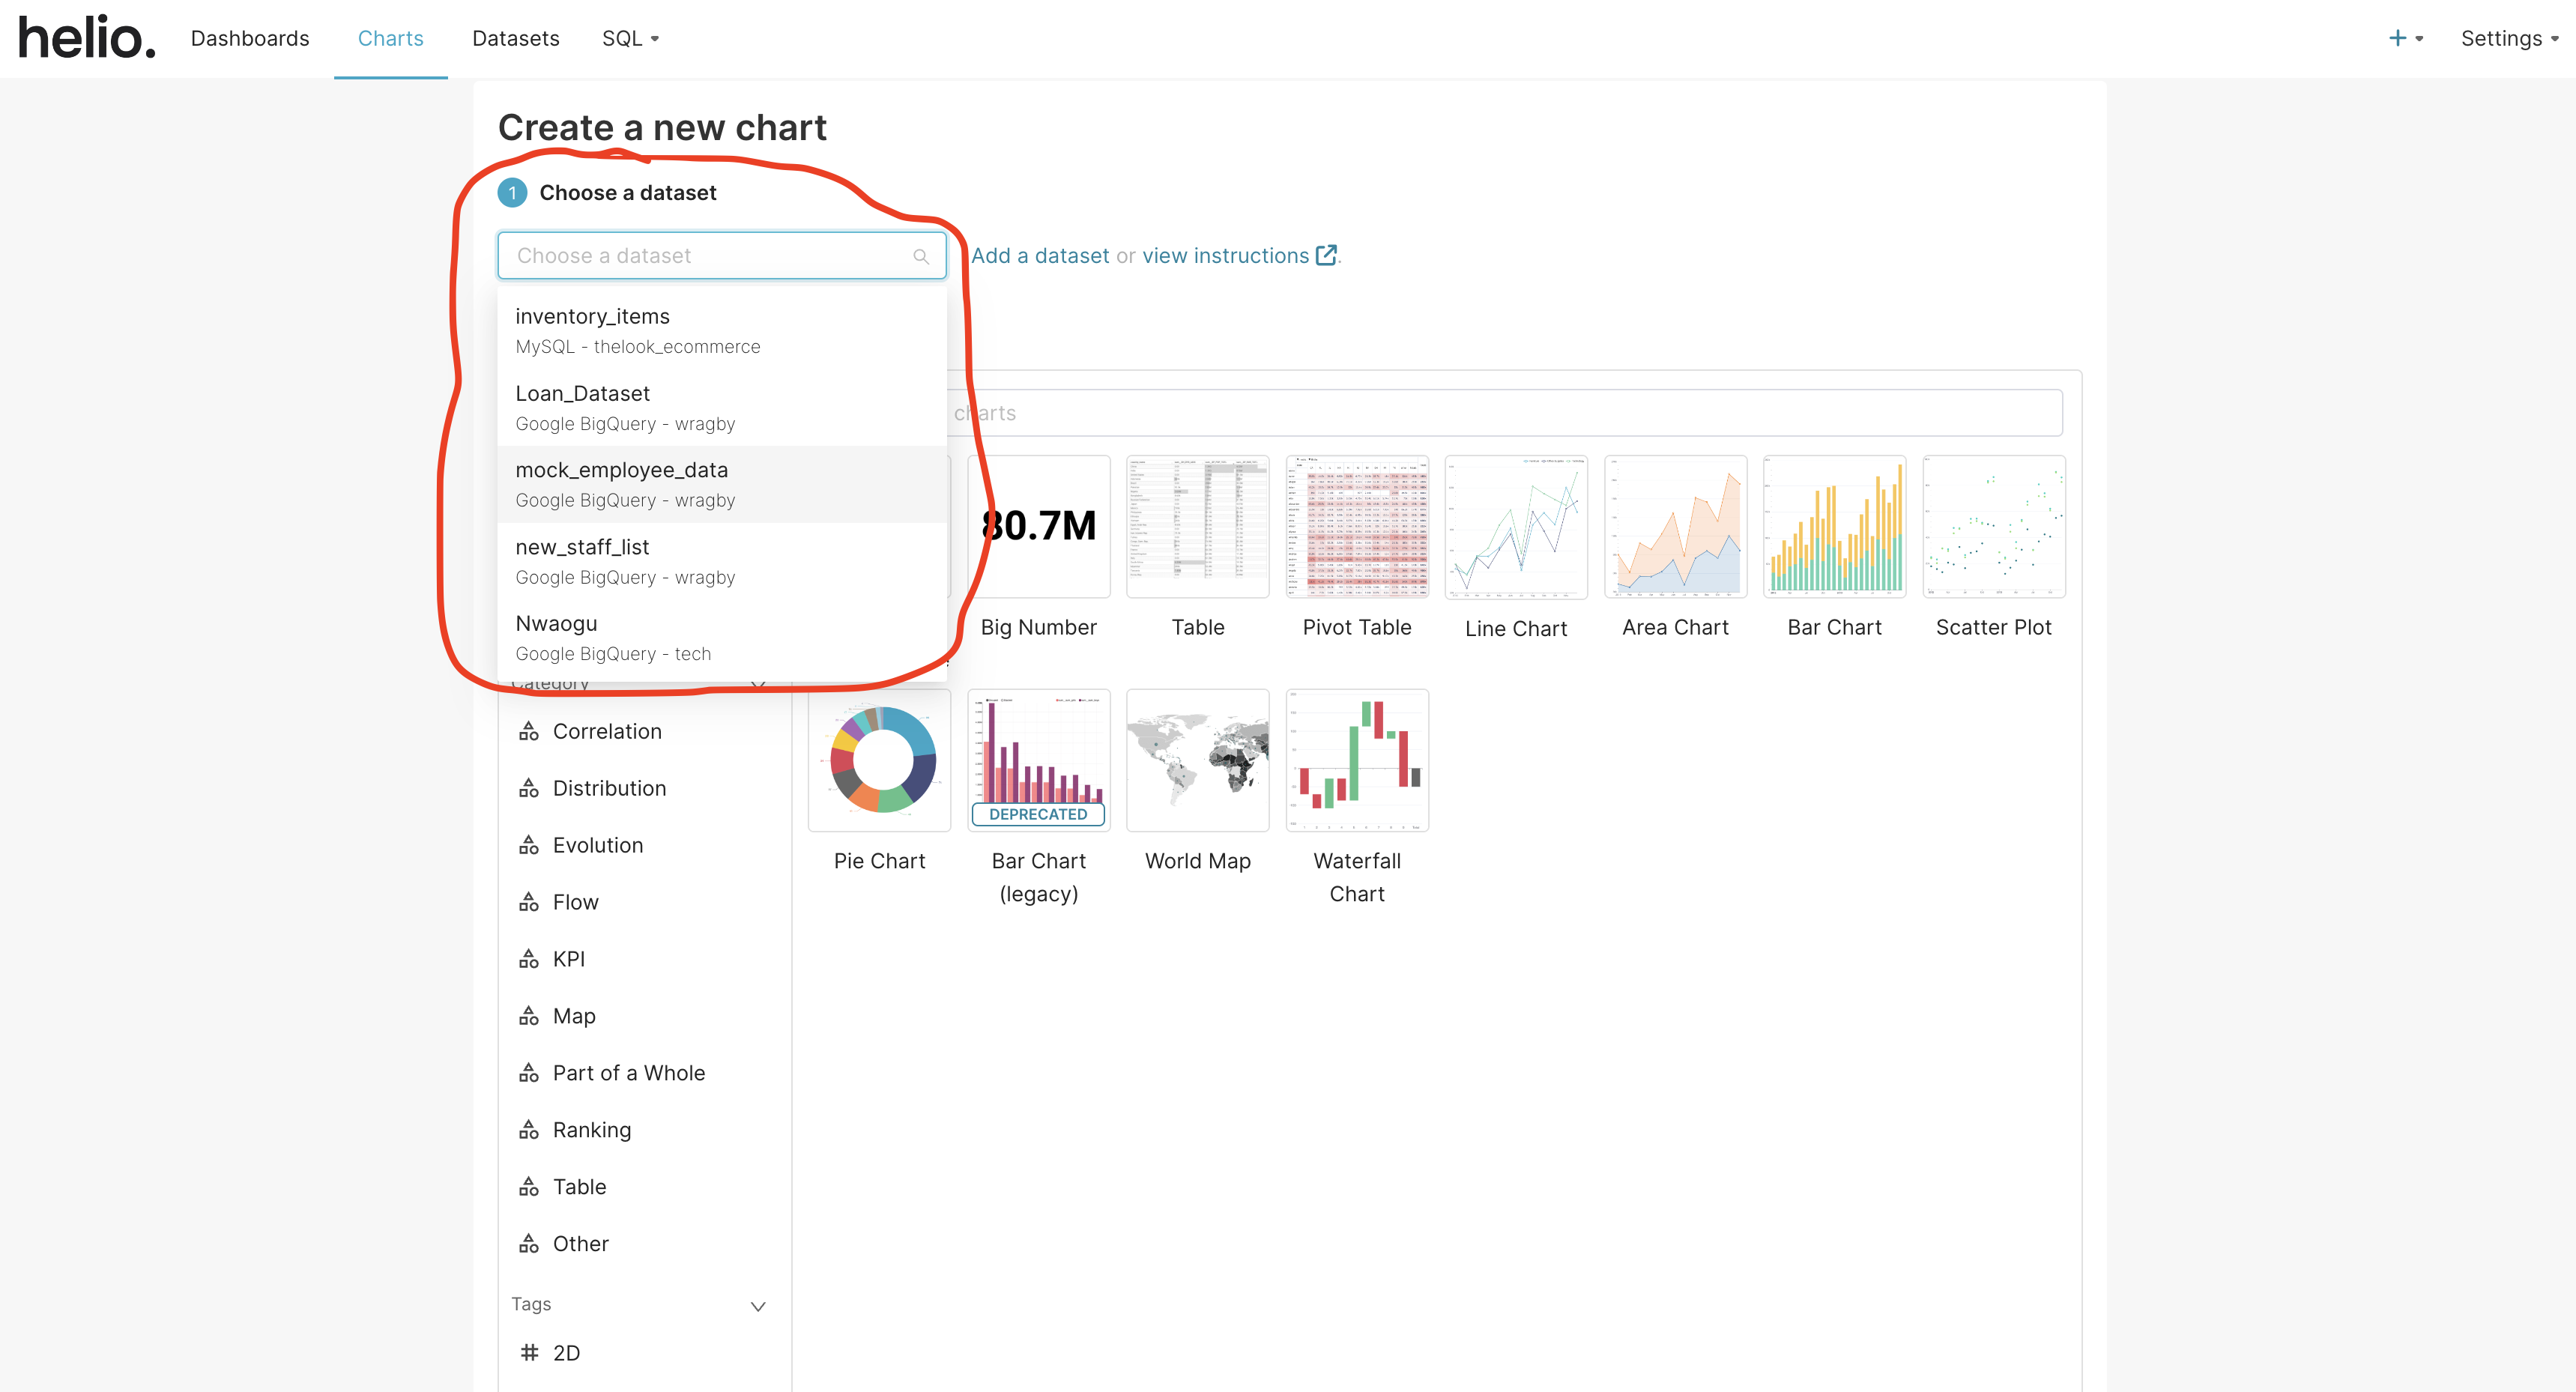
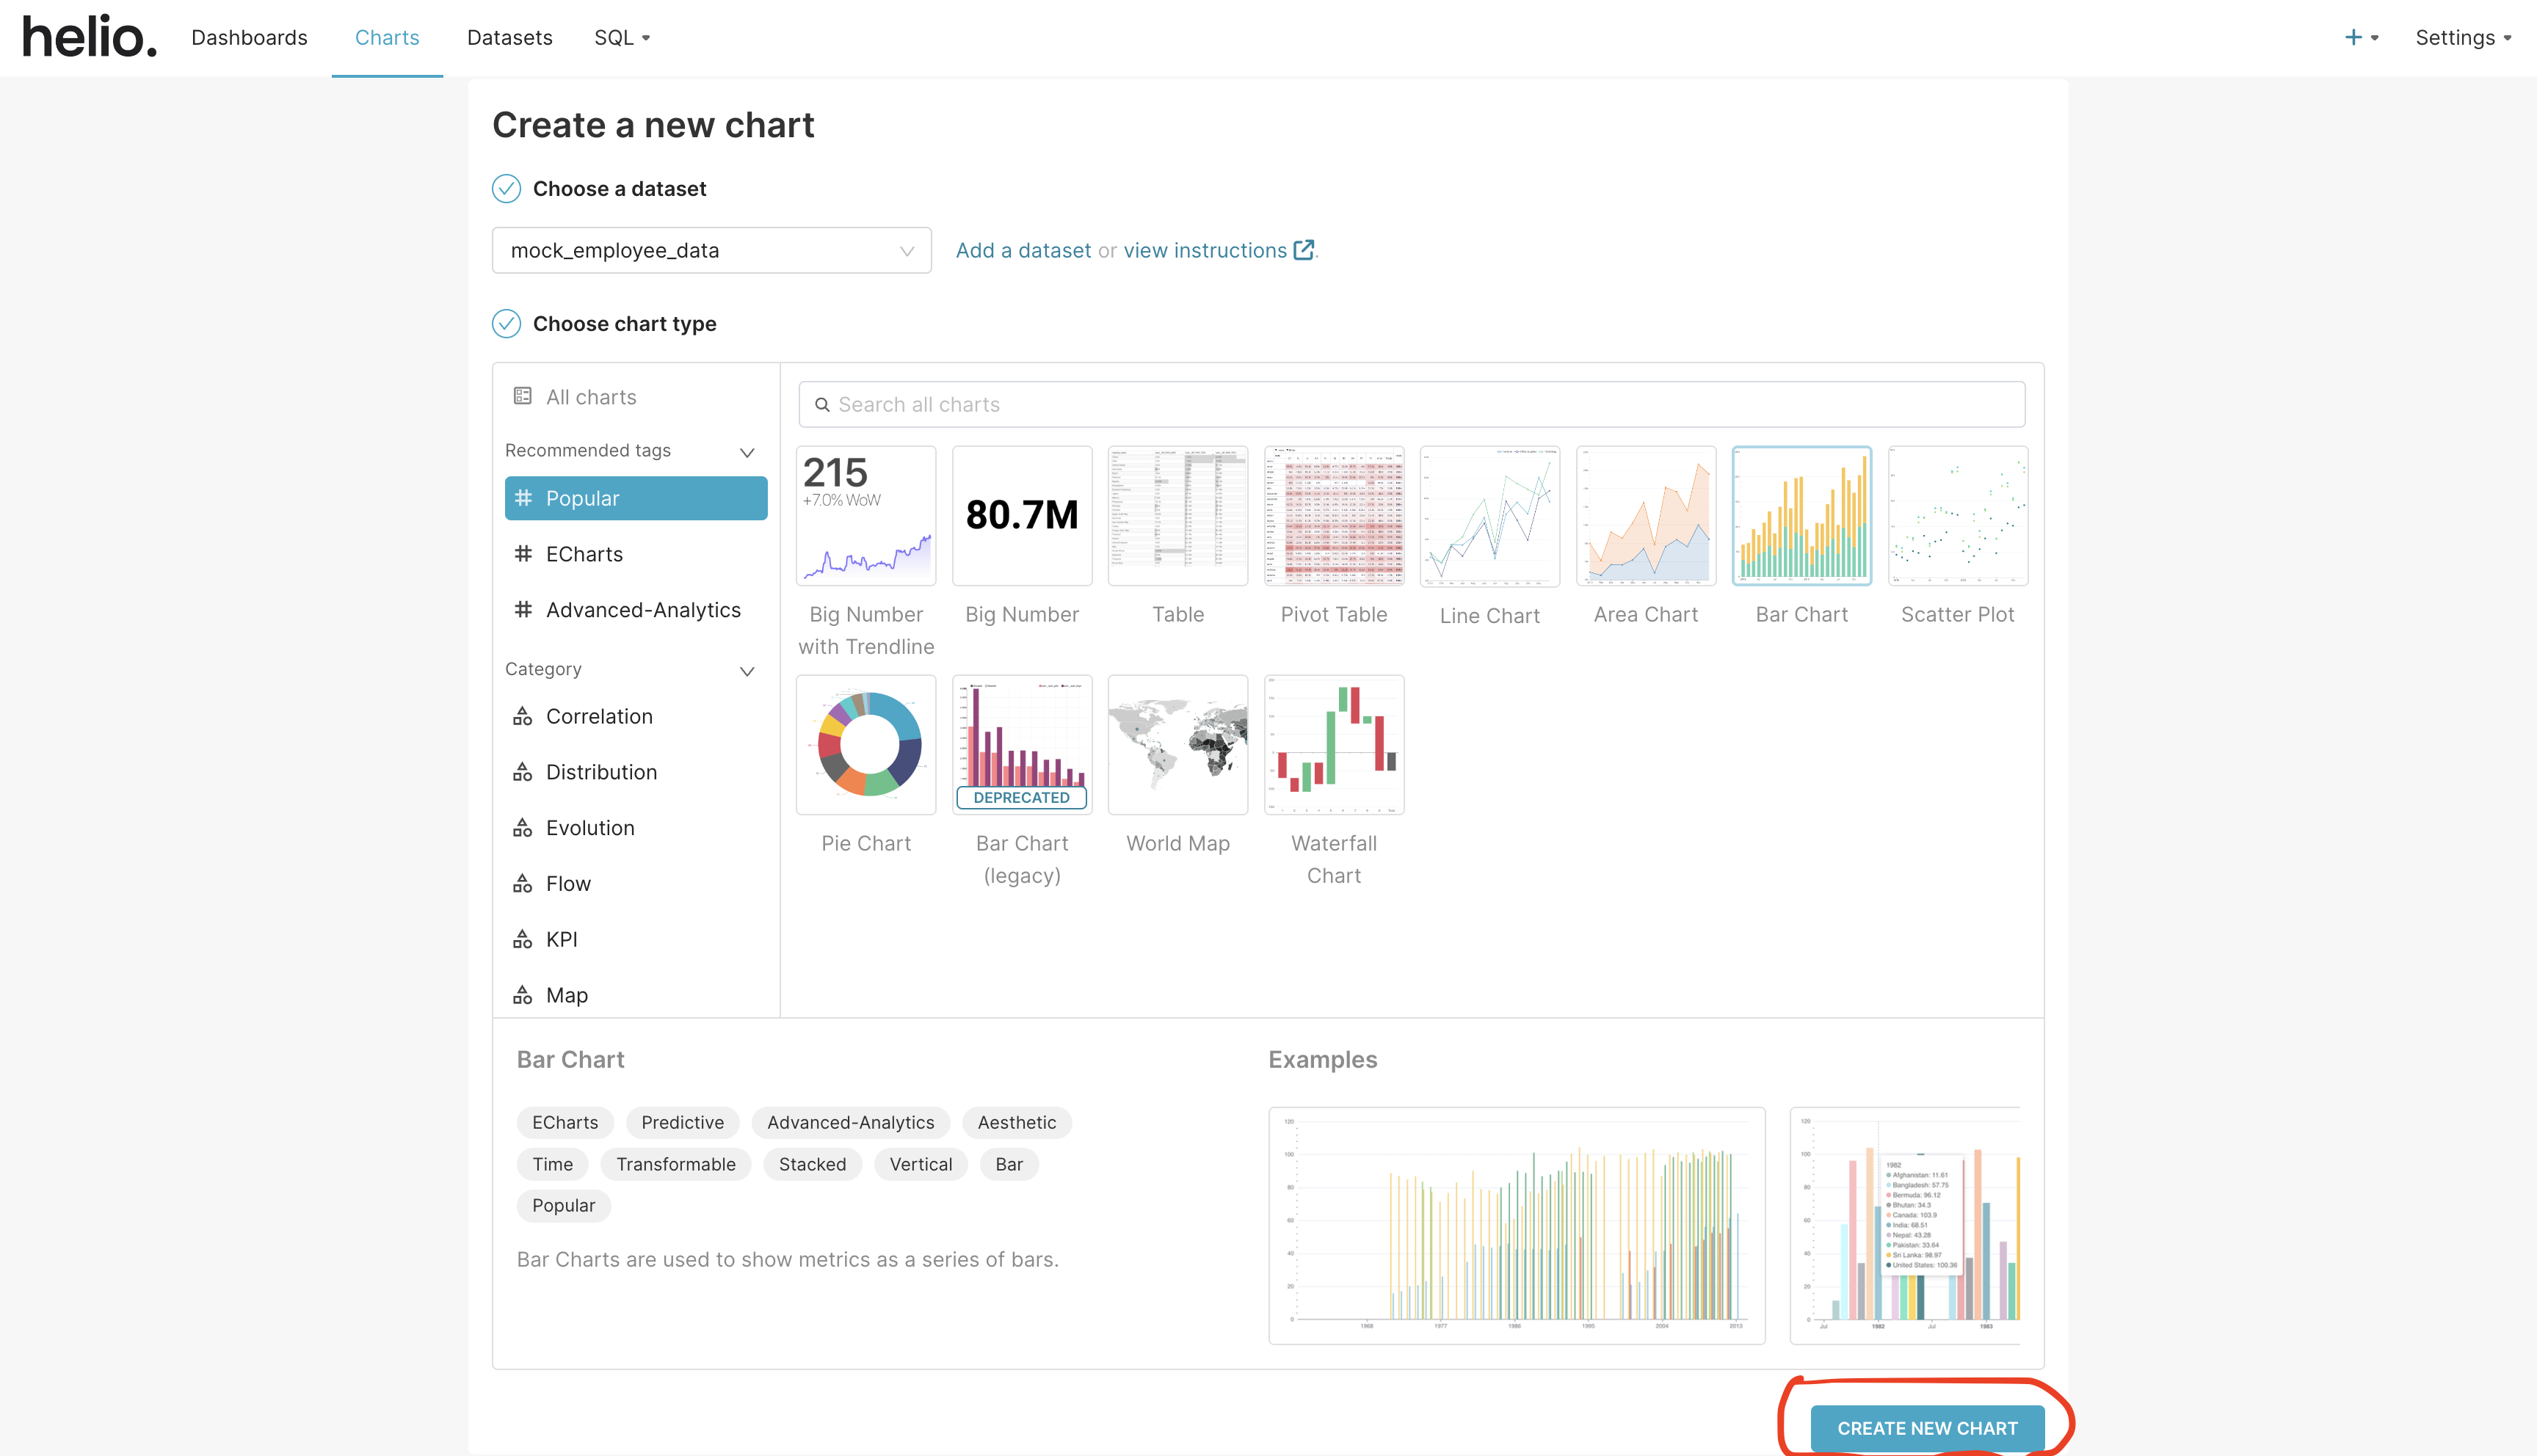
Choose Your Dataset and Chart Type
Choose a dataset to work with among the list of datasets in the select input options. We are going to select mock_employee_data as our option in this example.
Select the chart type. In this example, we are going to select the bar chart under the list of popular charts.
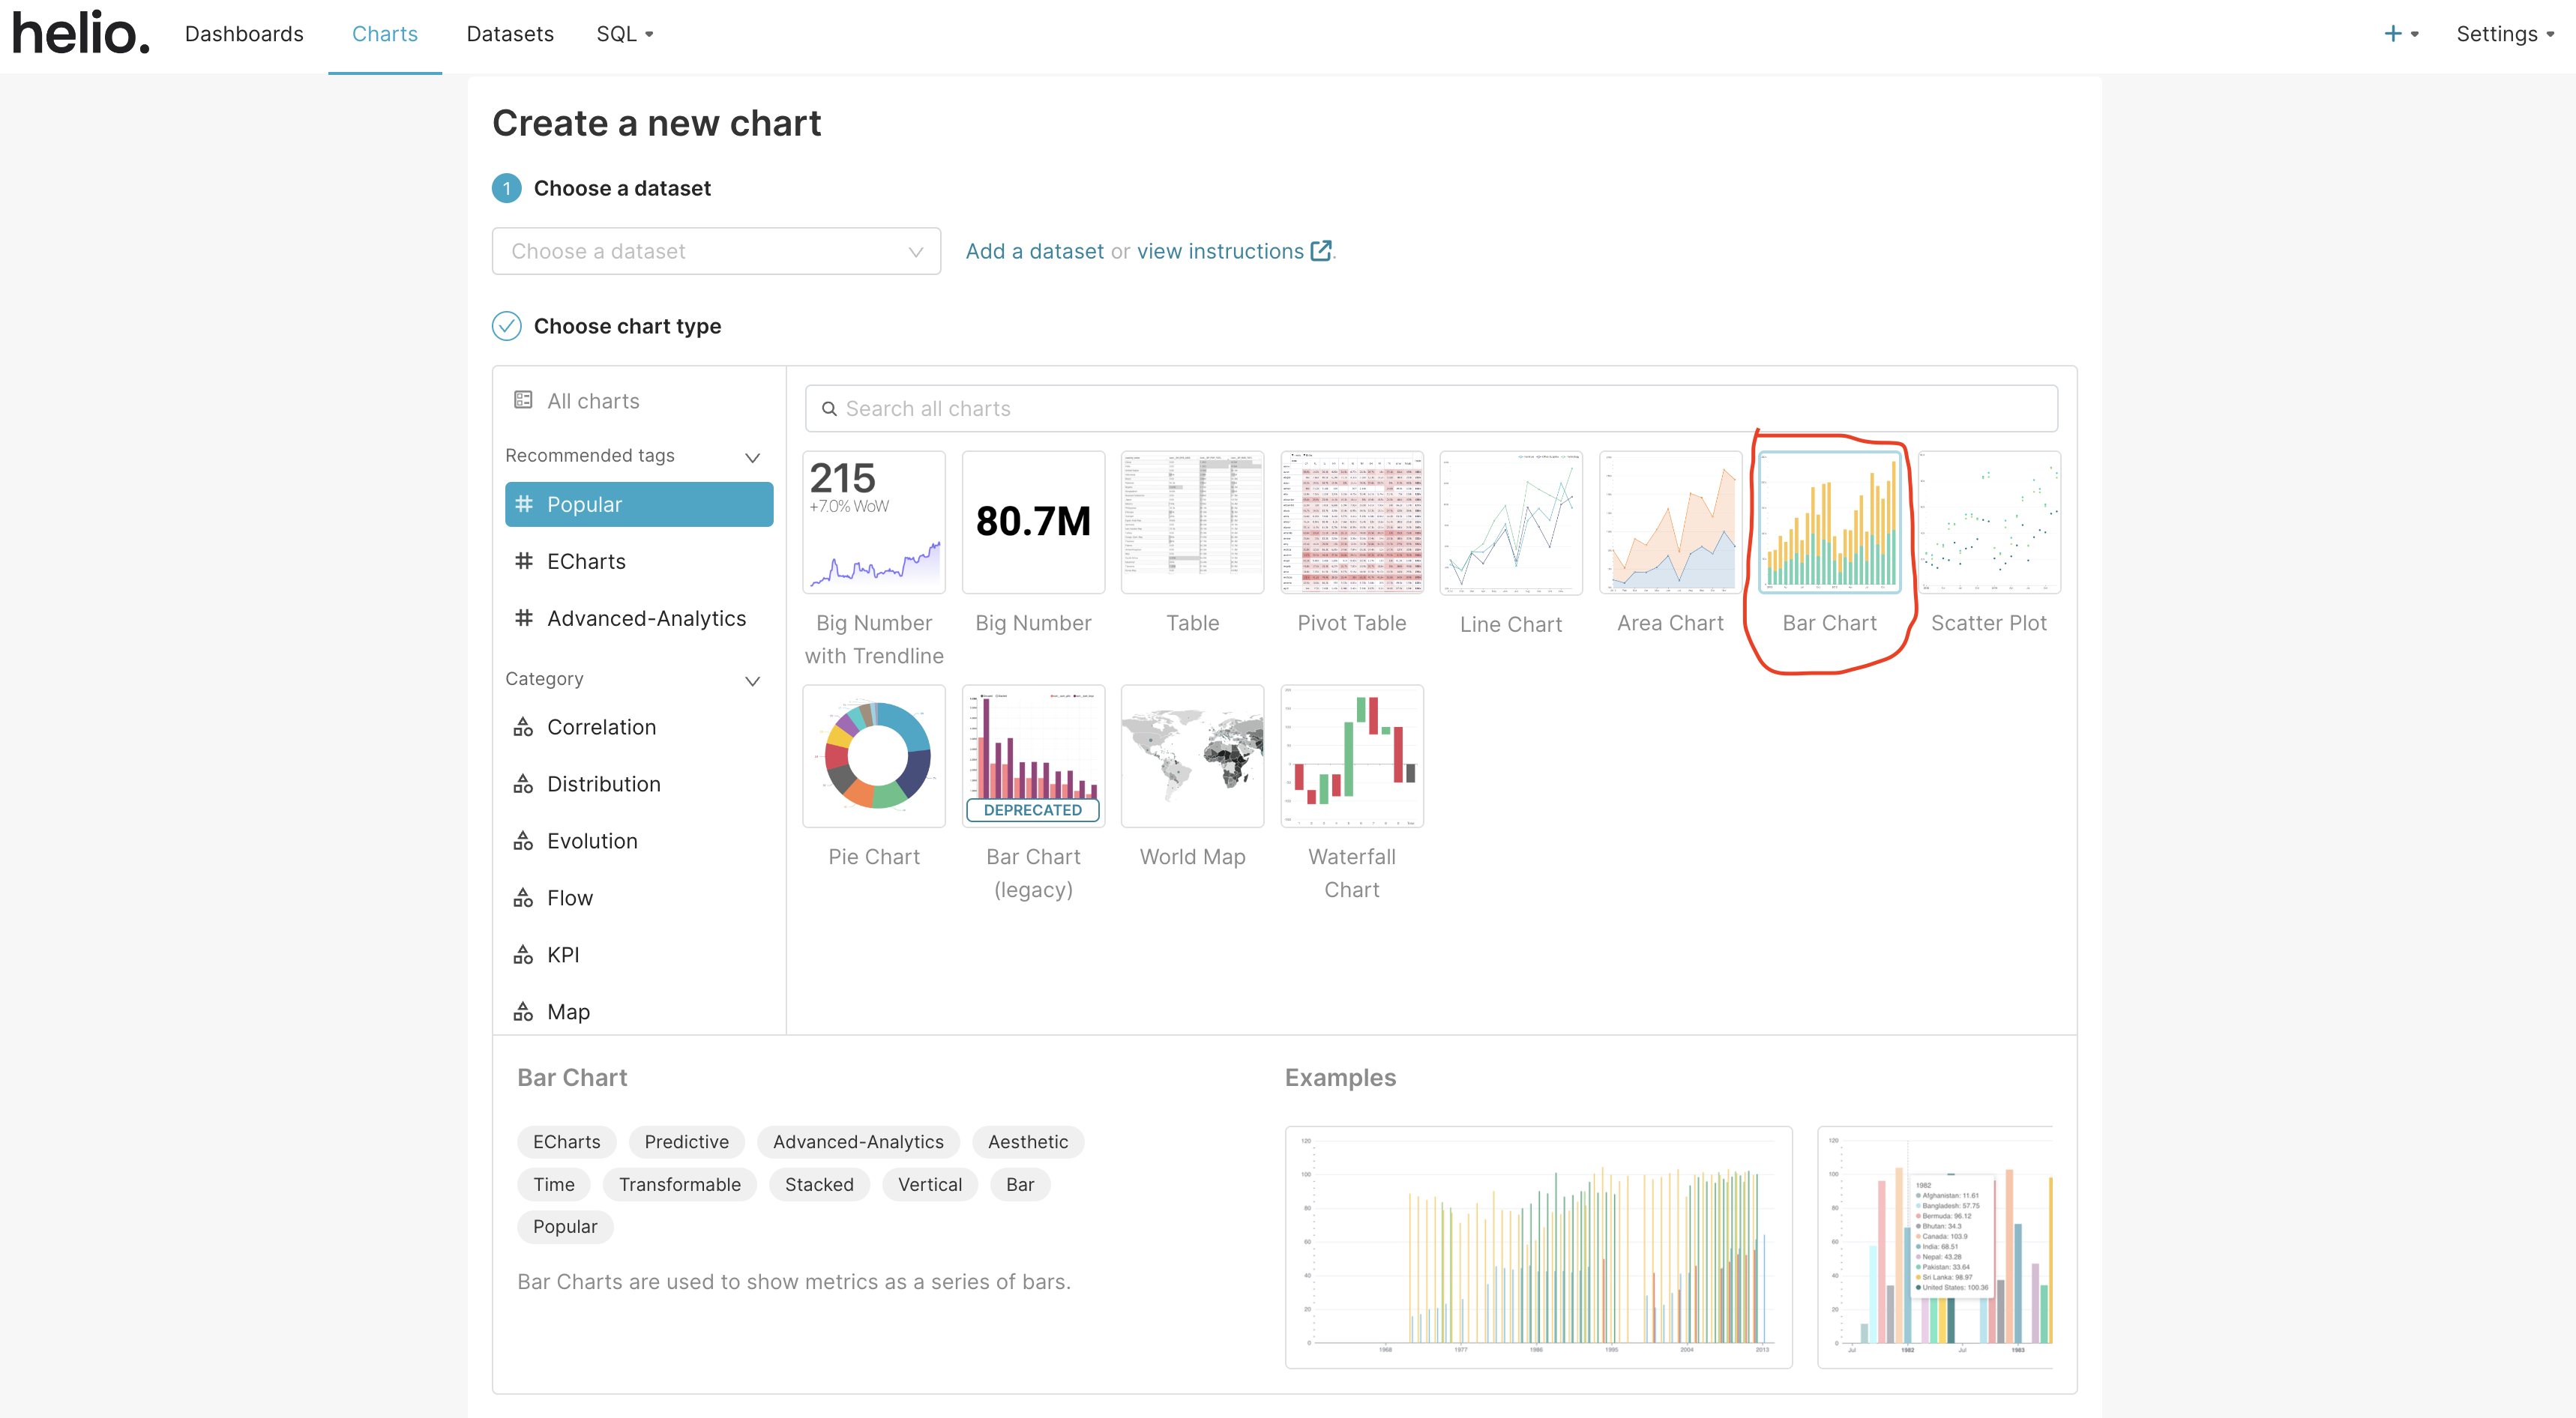
When you are done, click on the “CREATE NEW CHART” button at the bottom of the page.
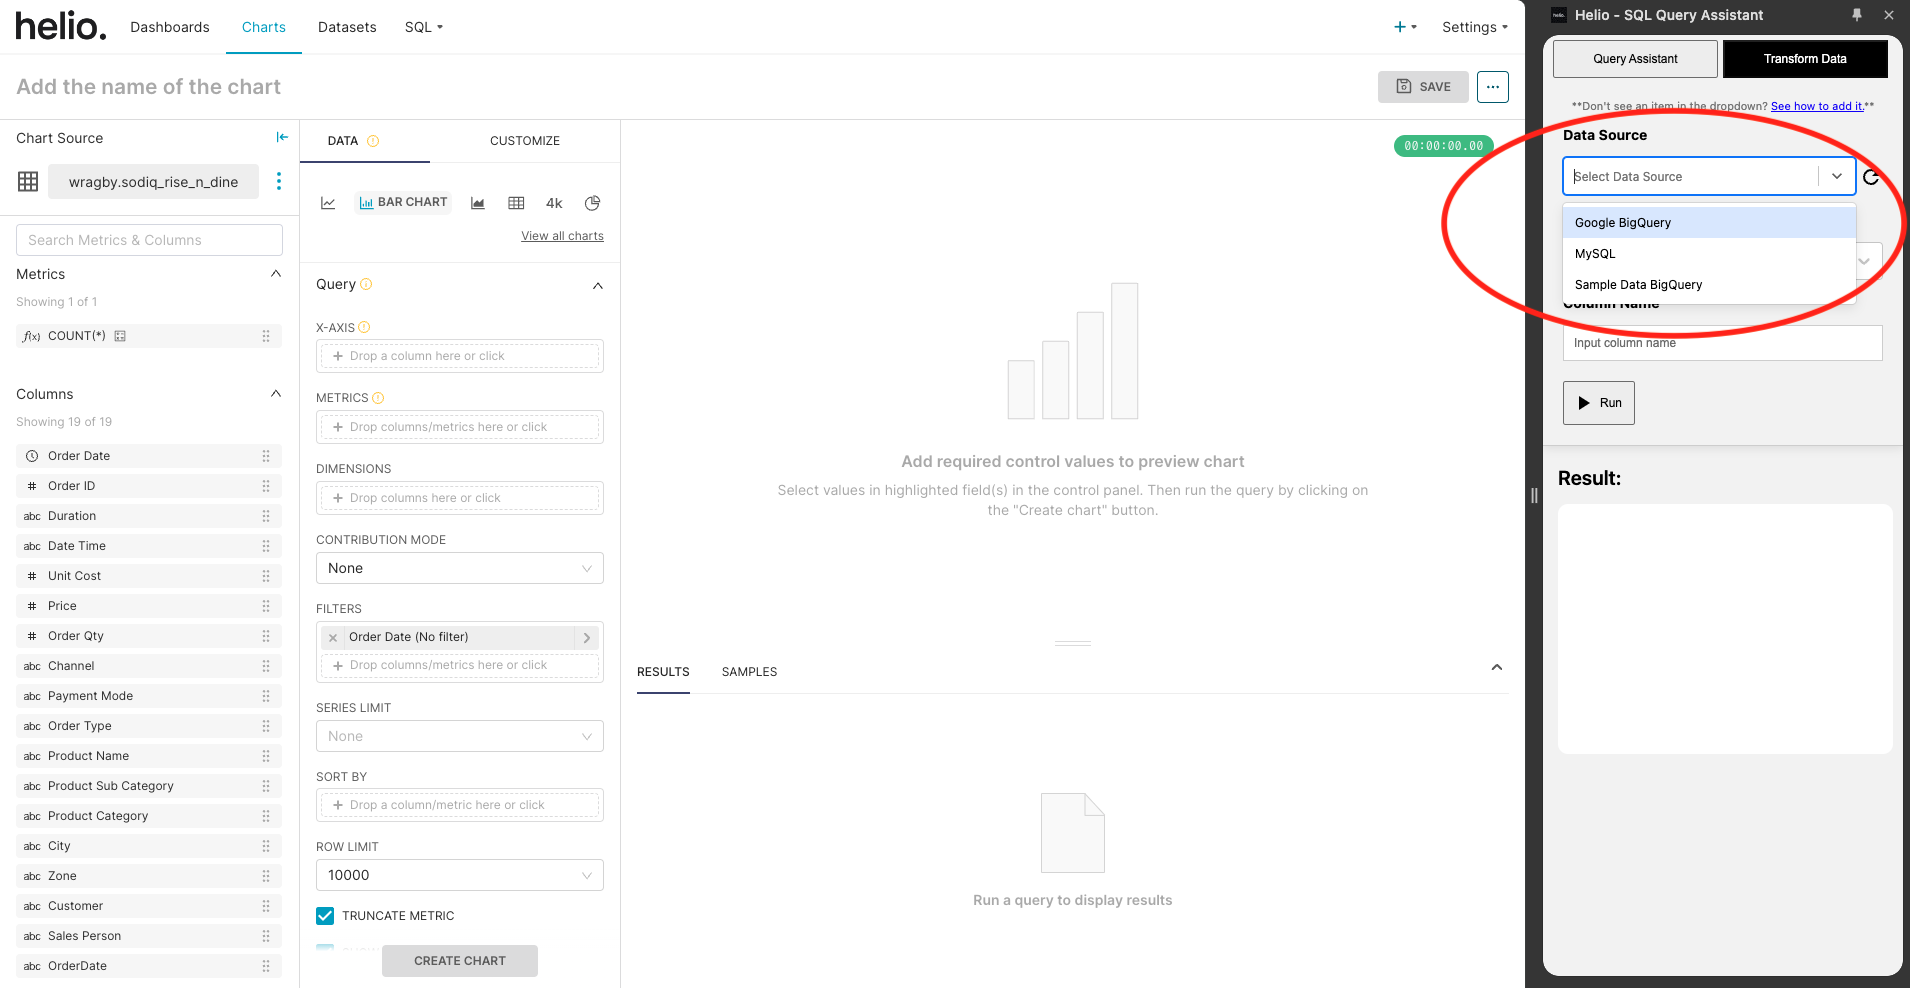
Select Your Data Source And Transformation Type, And Input Column Name in the Extension
In the extension, click on “Transform Data” at the top of the screen. You can then select your choice from the list of data sources. In this example, we will select Google BigQuery.
Next is to select the transformation type. We are going to choose “Format date to MM/DD/YYYY” in this example.
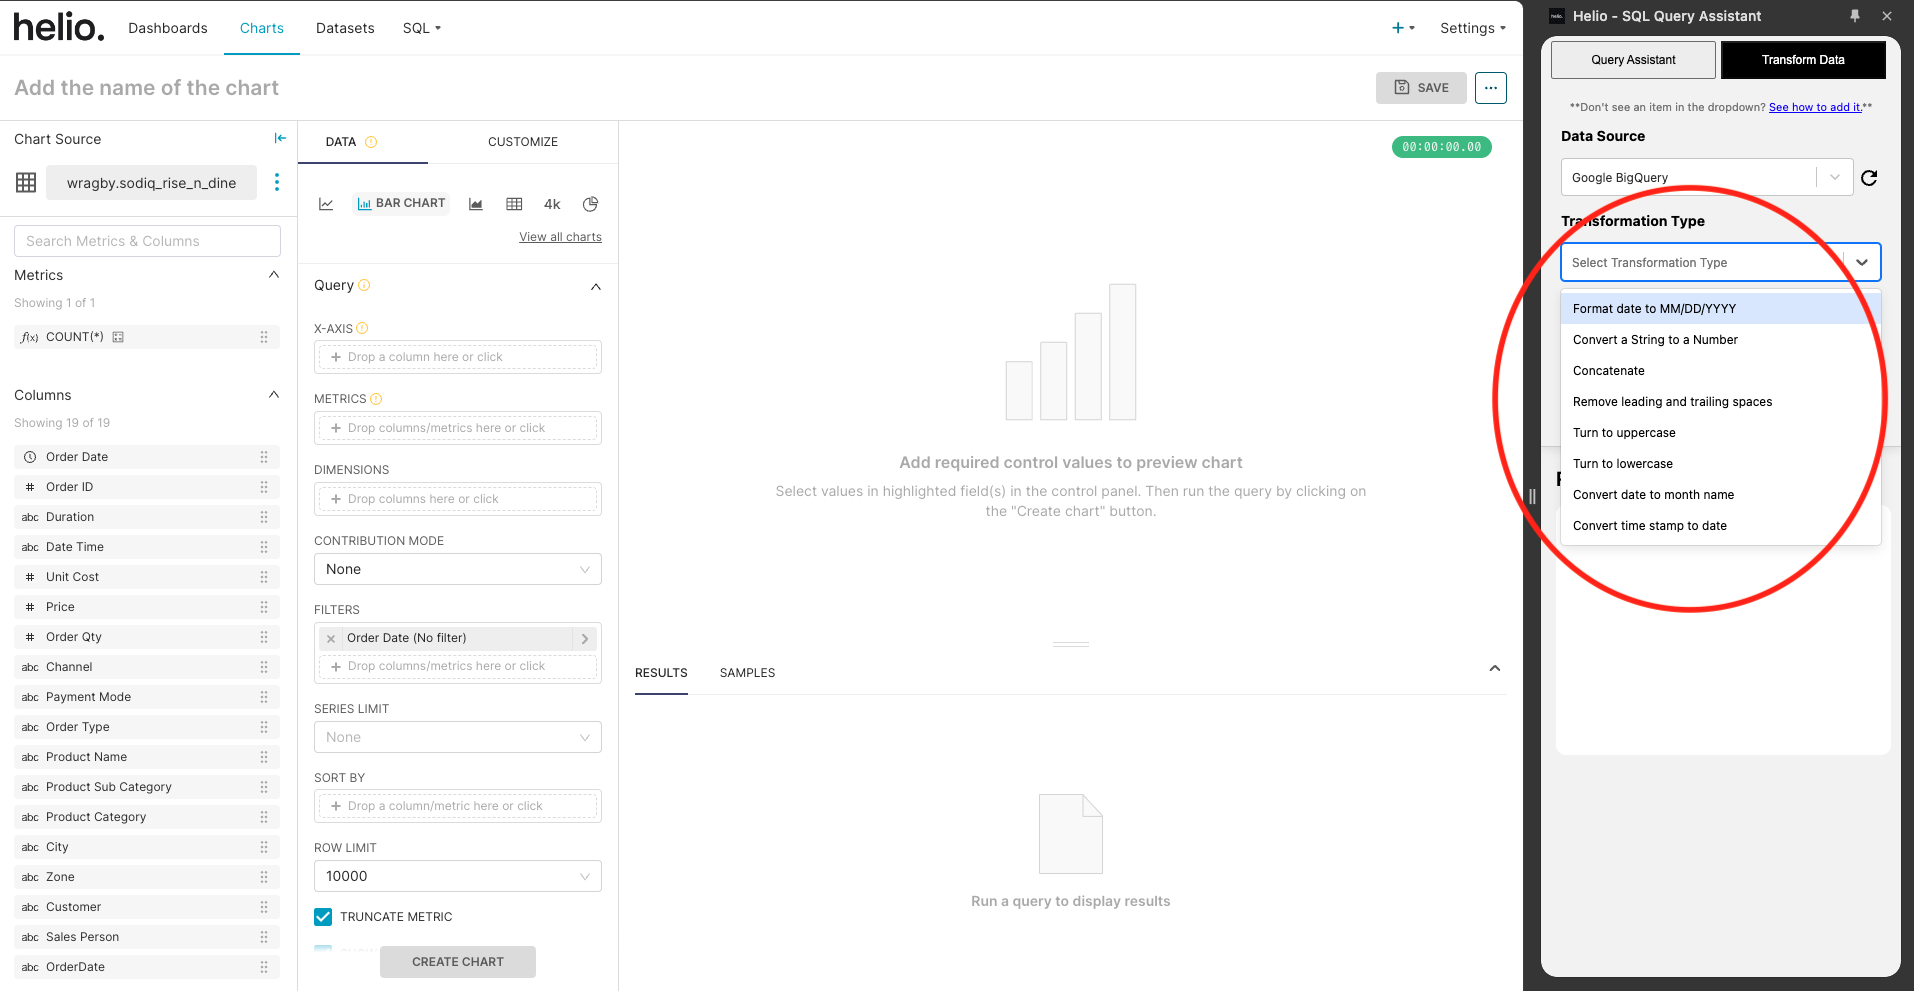
You will then input the name of the column whose data you want to transform. Let’s transform the data in “Order Date”. Click on the “Run” button below the input once you are done to run it.

Copy The Result And Paste It Into Your Chart
Now, you copy the result from from the helio extension and paste it into the chart.

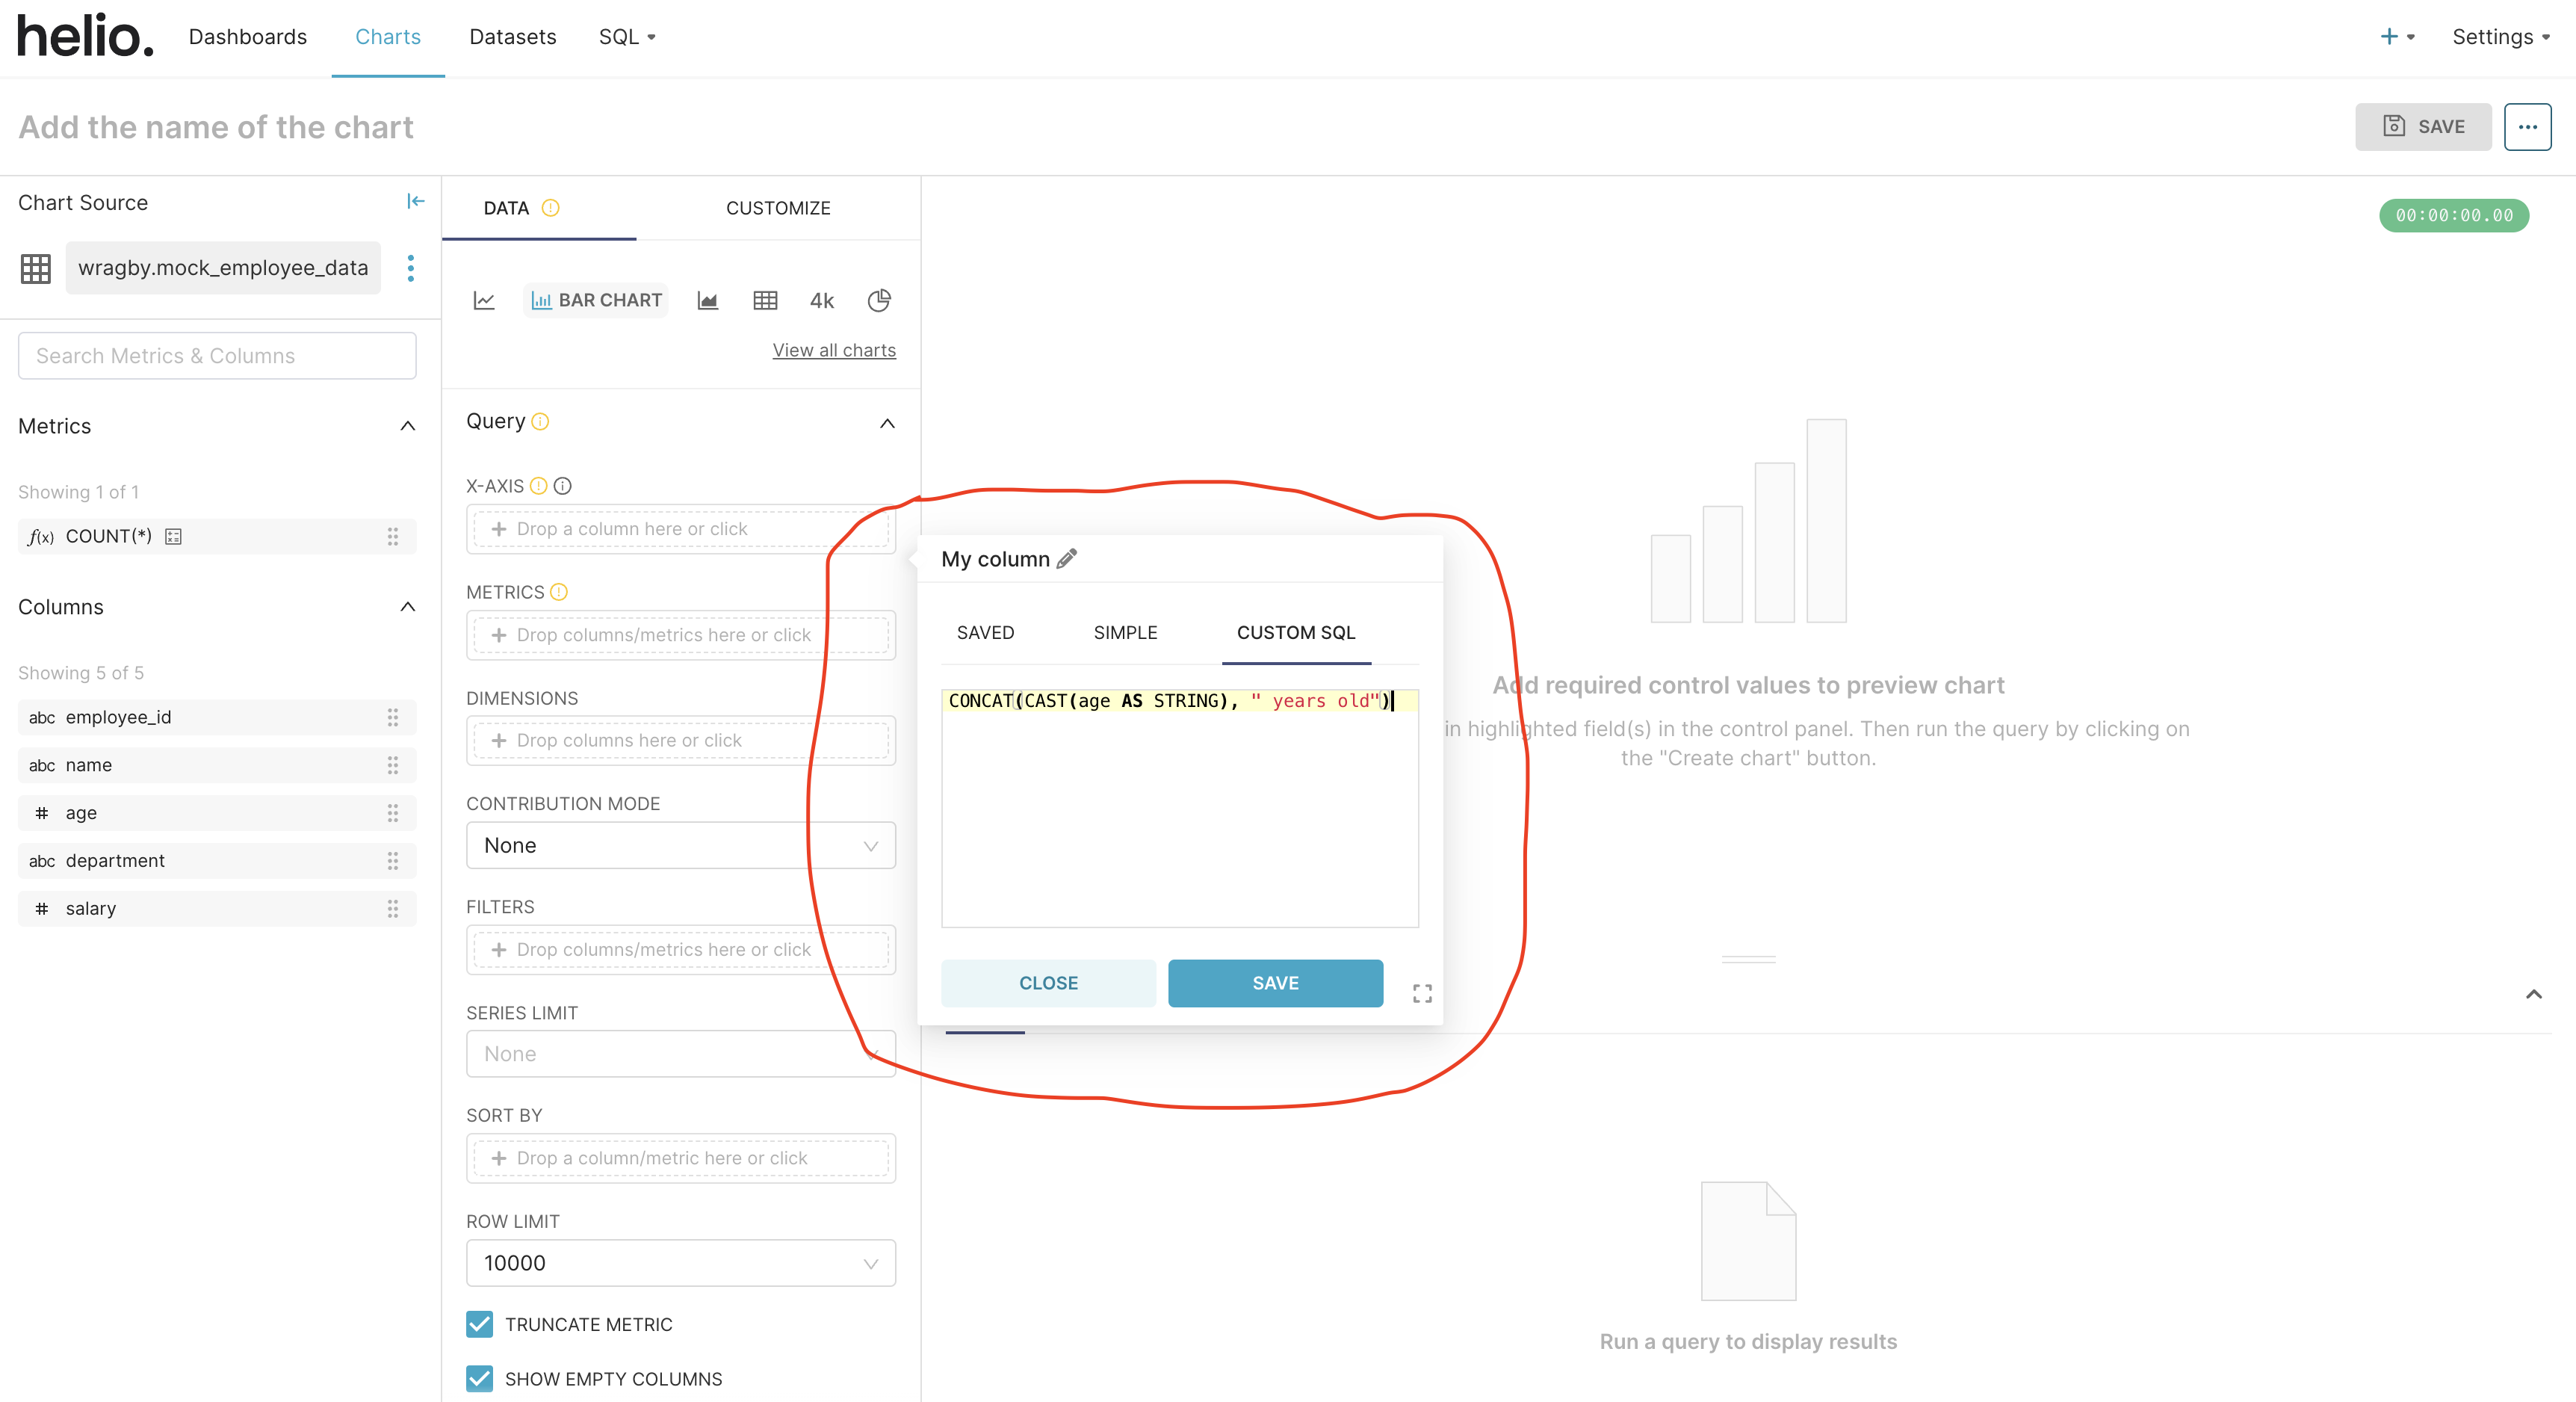
Select and configure data for the x-axis and metrics, ensuring your visualizations accurately represent your data. Choose the CUSTOM SQL option under the X-AXIS modal and customize your data.
FORMAT_DATETIME("%x", DATE(`Order Date`))
In the command above, the code will transform the date. After converting our age column to a string, we can equally concatenate another string to it.
CONCAT(CAST(age AS STRING), " years old")
The command above will concatenate “ years old” to the age column string. Write the command inside the CUSTOM-SQL and save it as shown below:
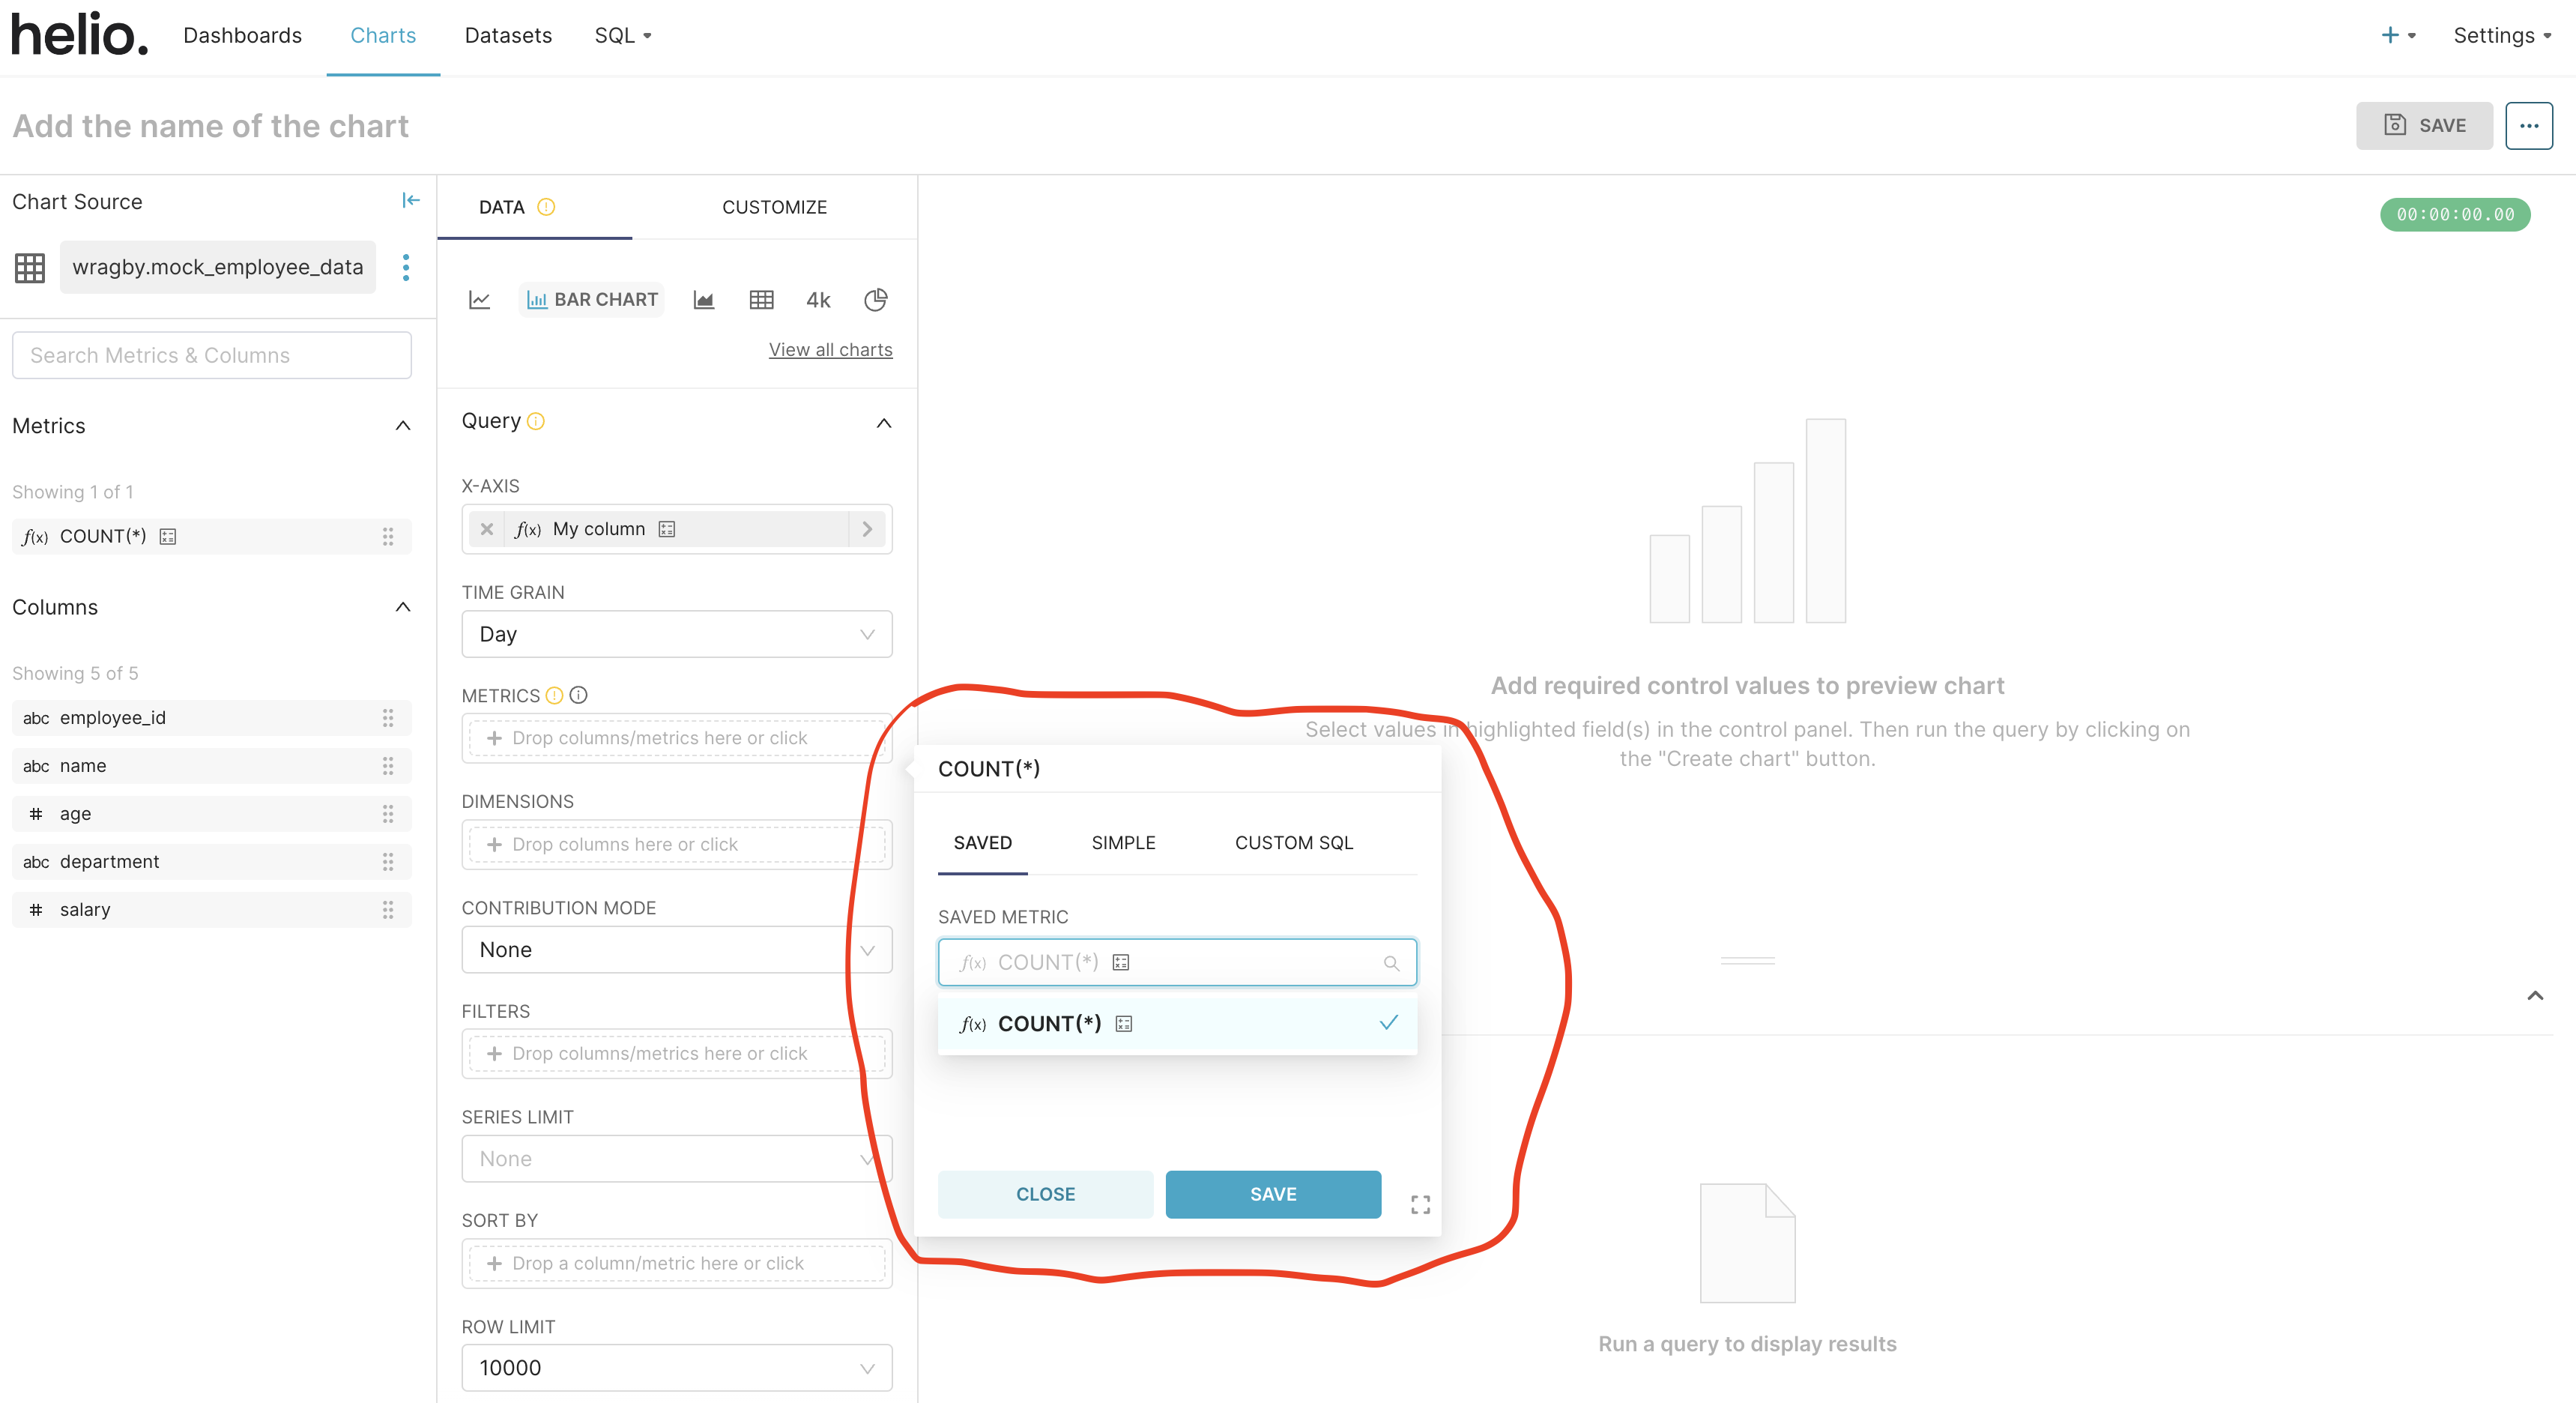
Choose your metrics and save.
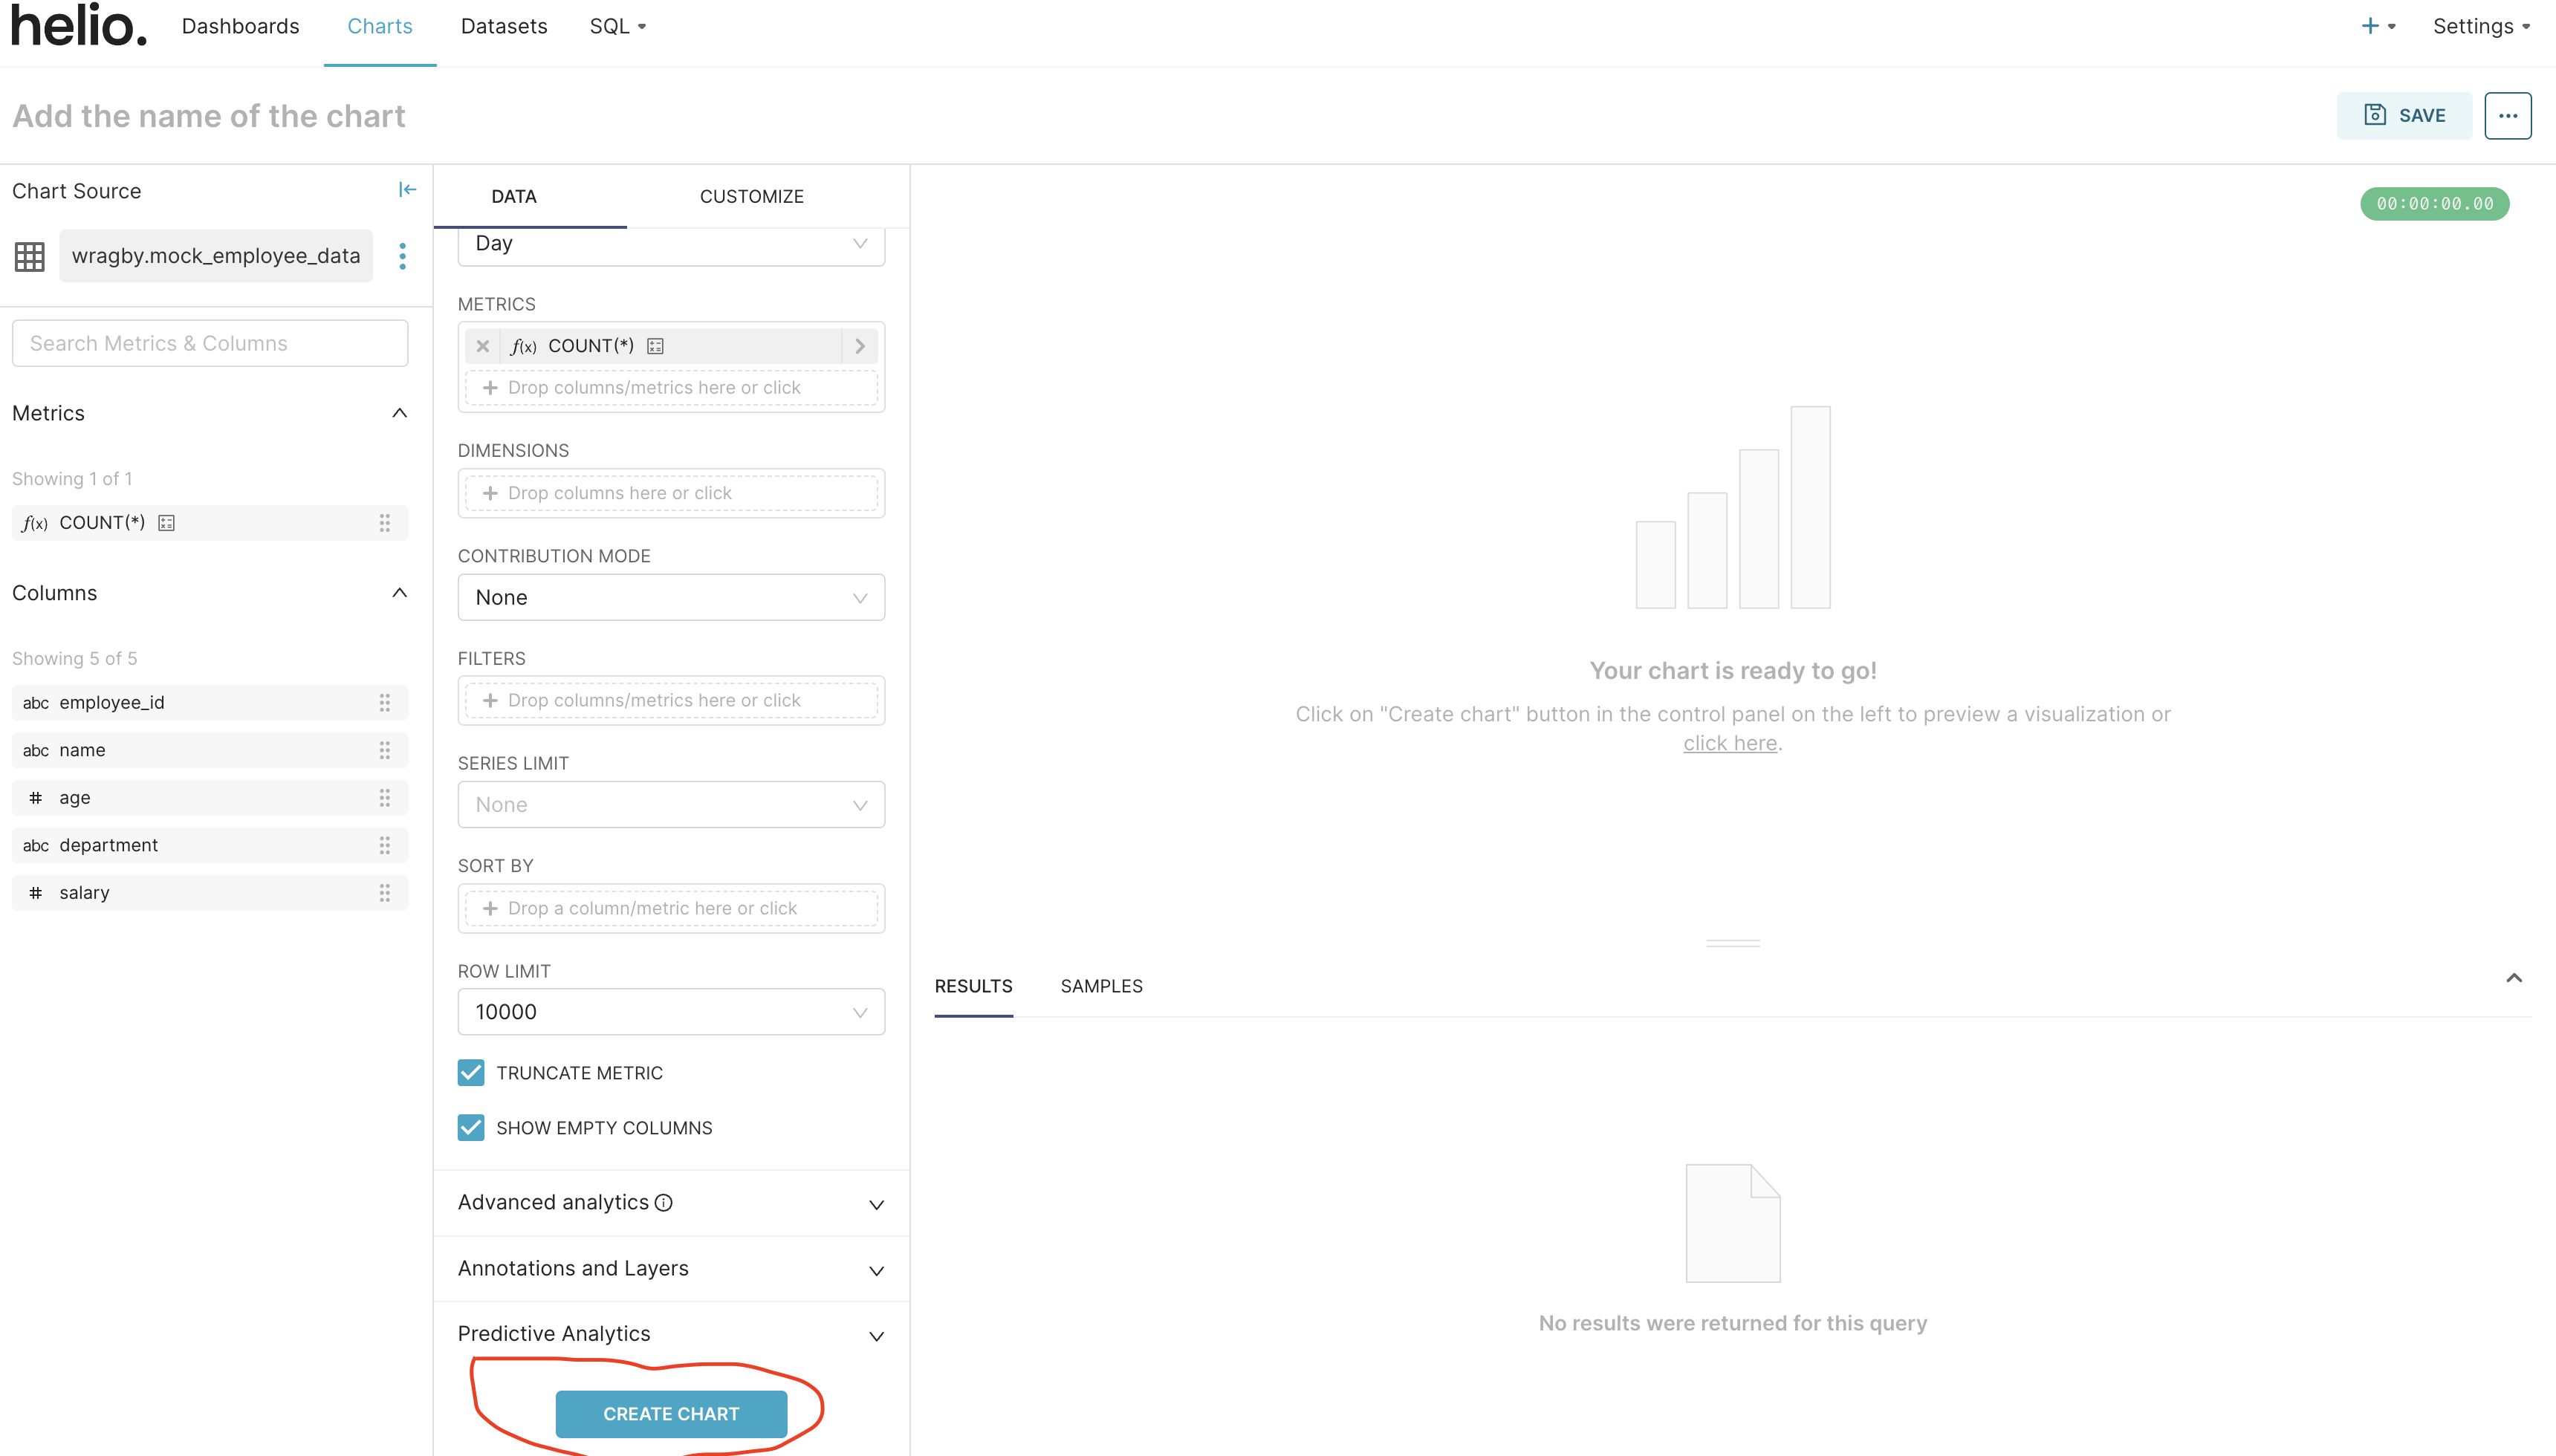
Visualize and Complete the Chart Creation
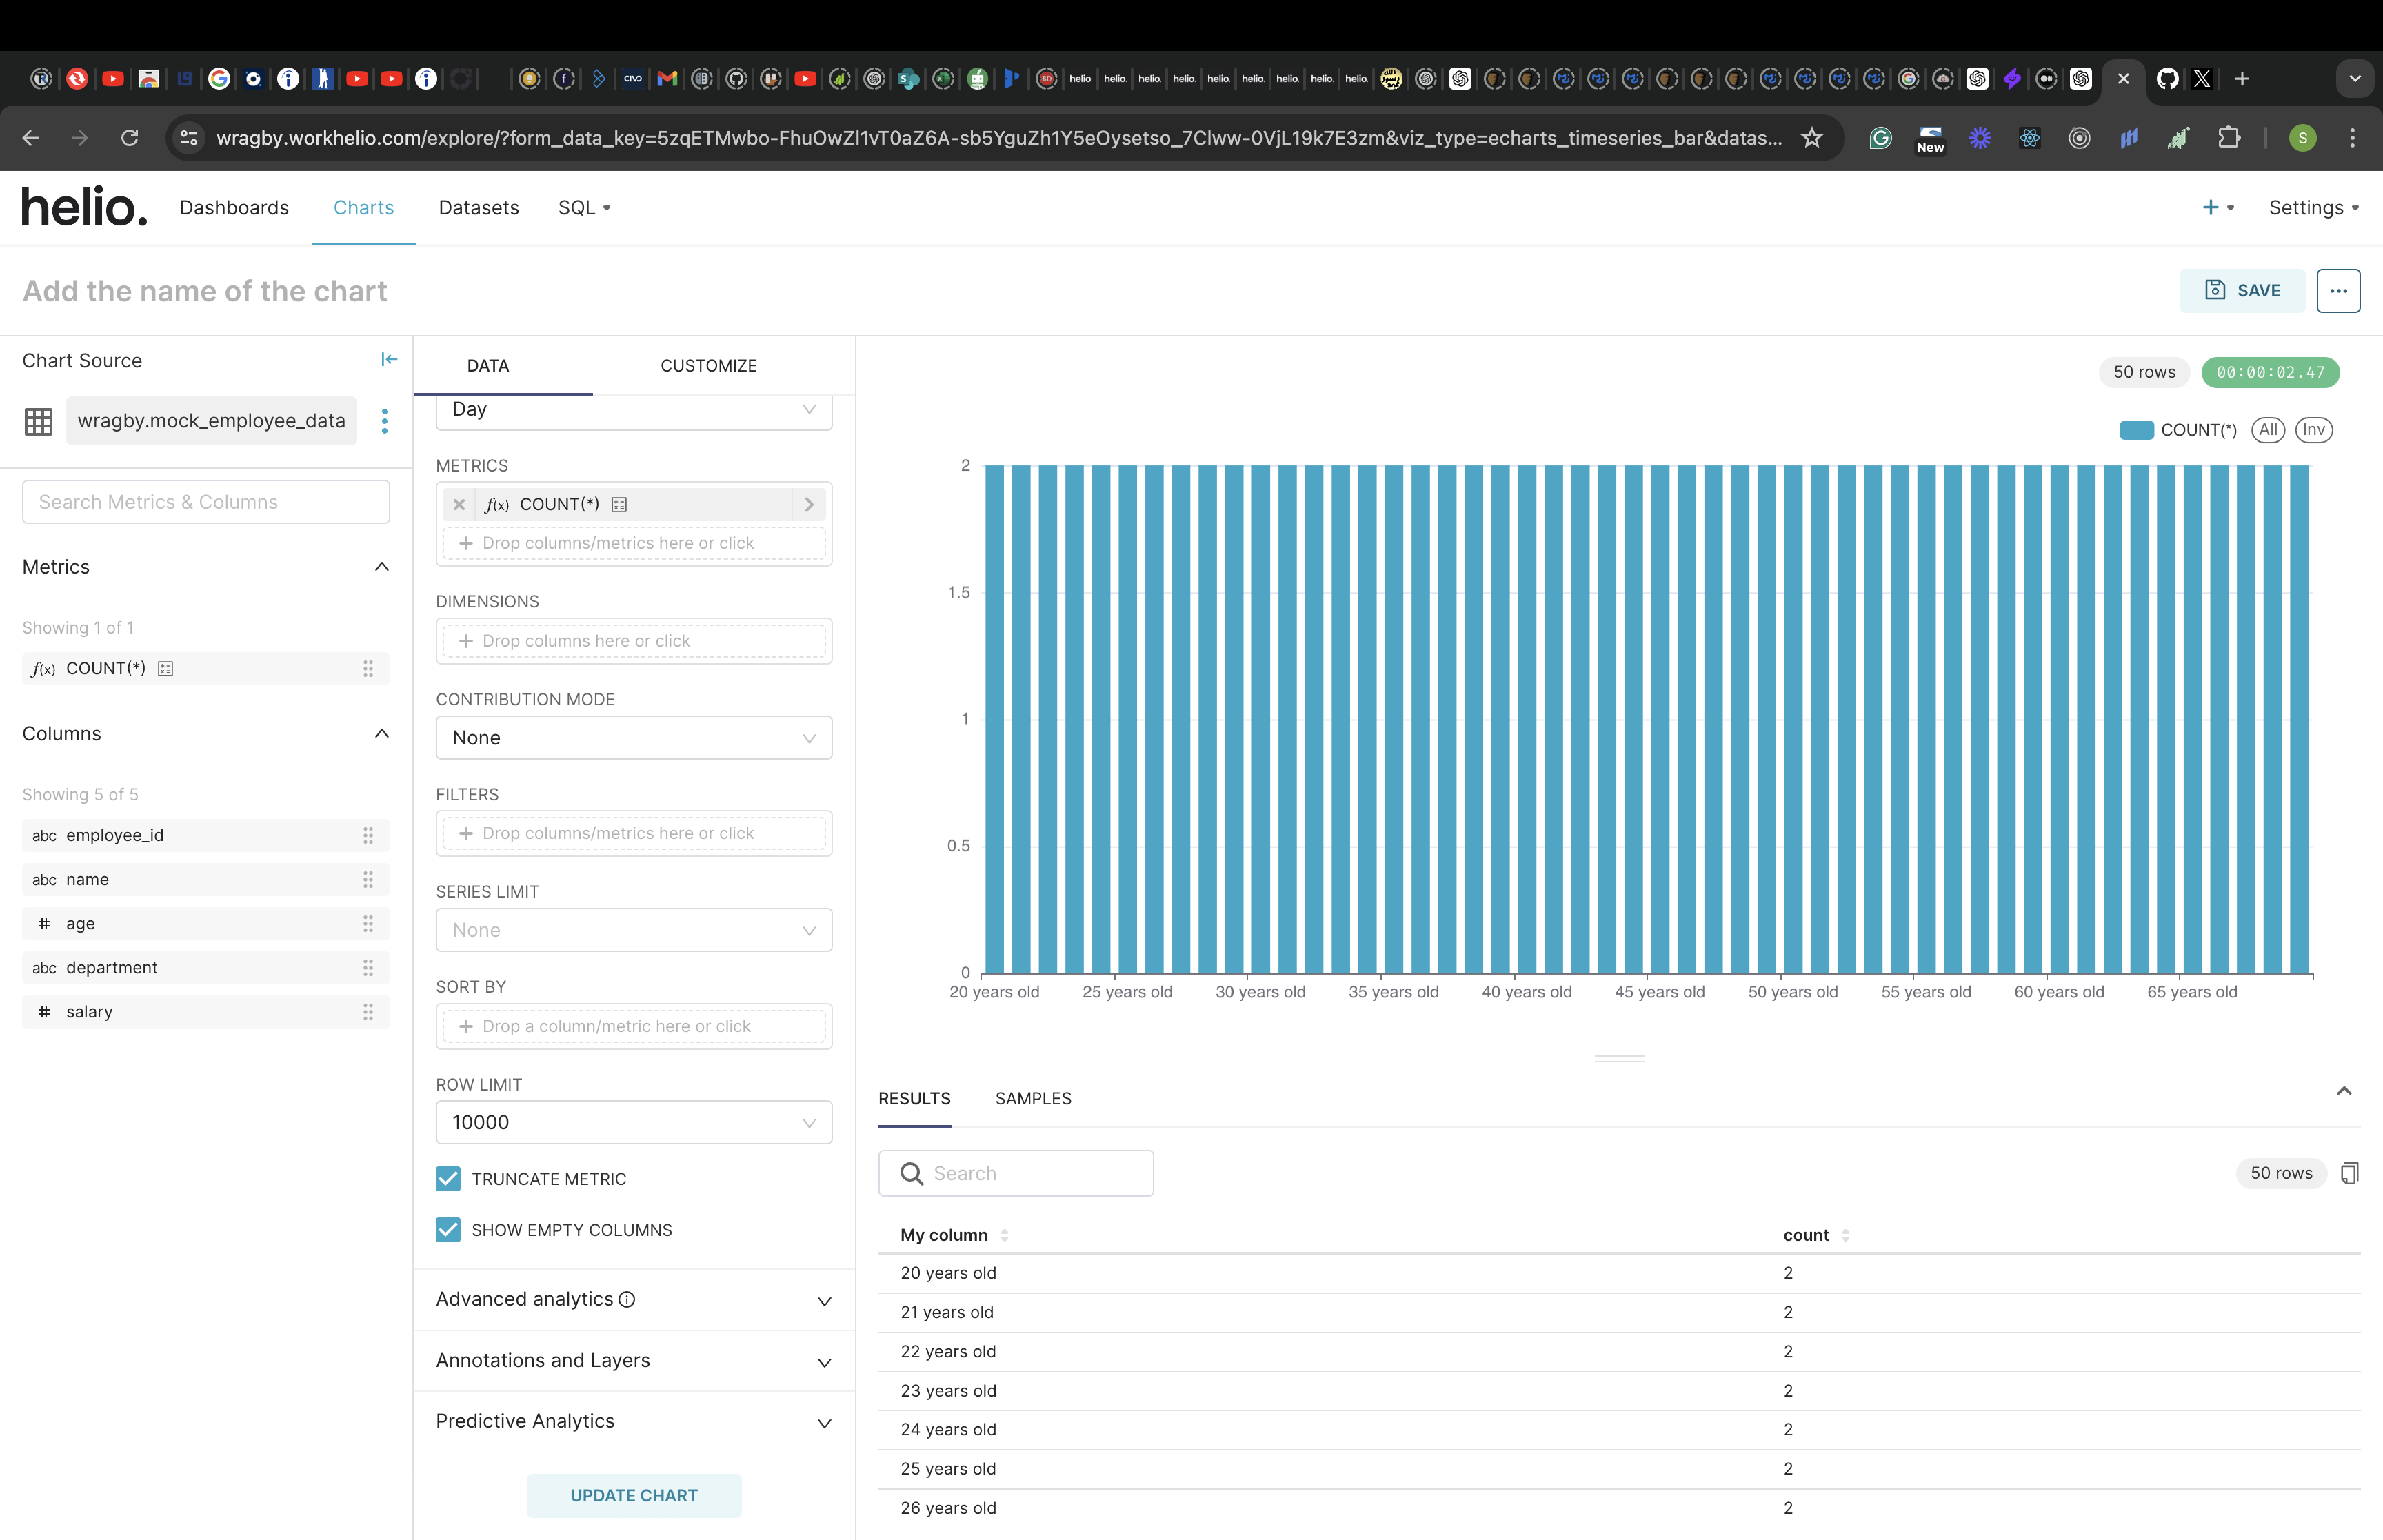
Click the “CREATE CHART” button at the bottom of the page to visualize your new chart.
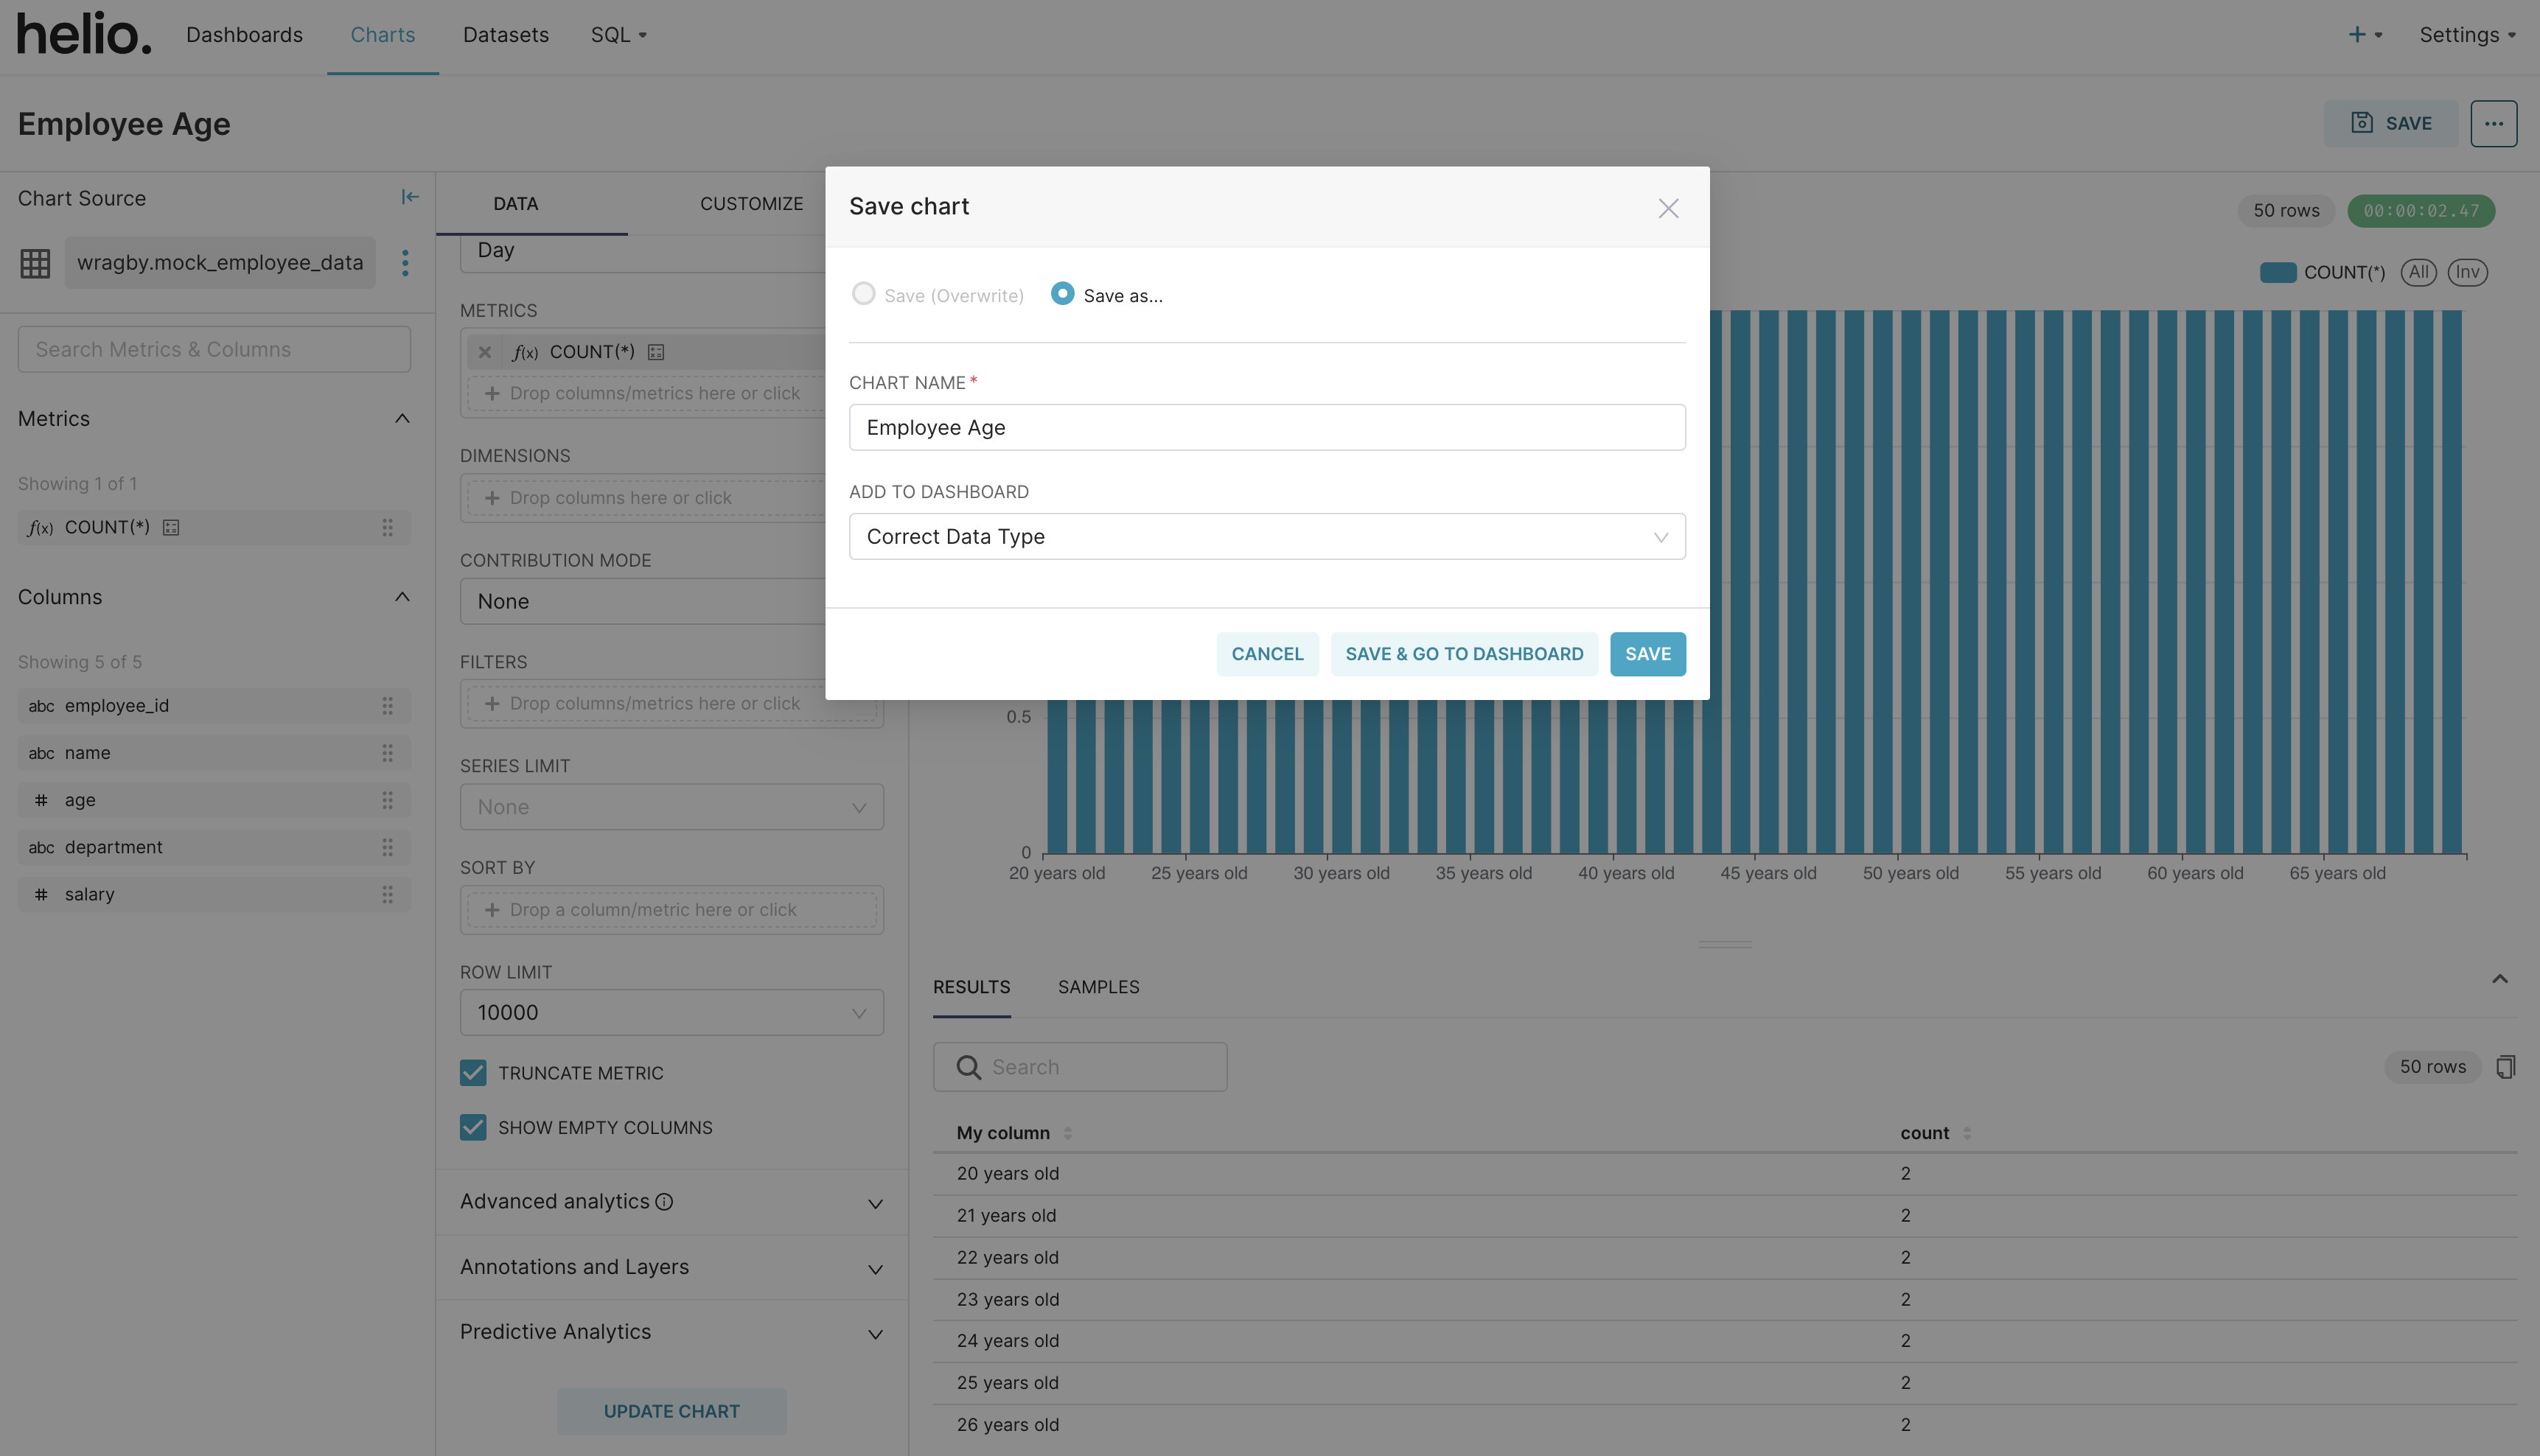
On the top-left of the page, add the name of the chart and click on the “SAVE” button at the top-right of the screen.
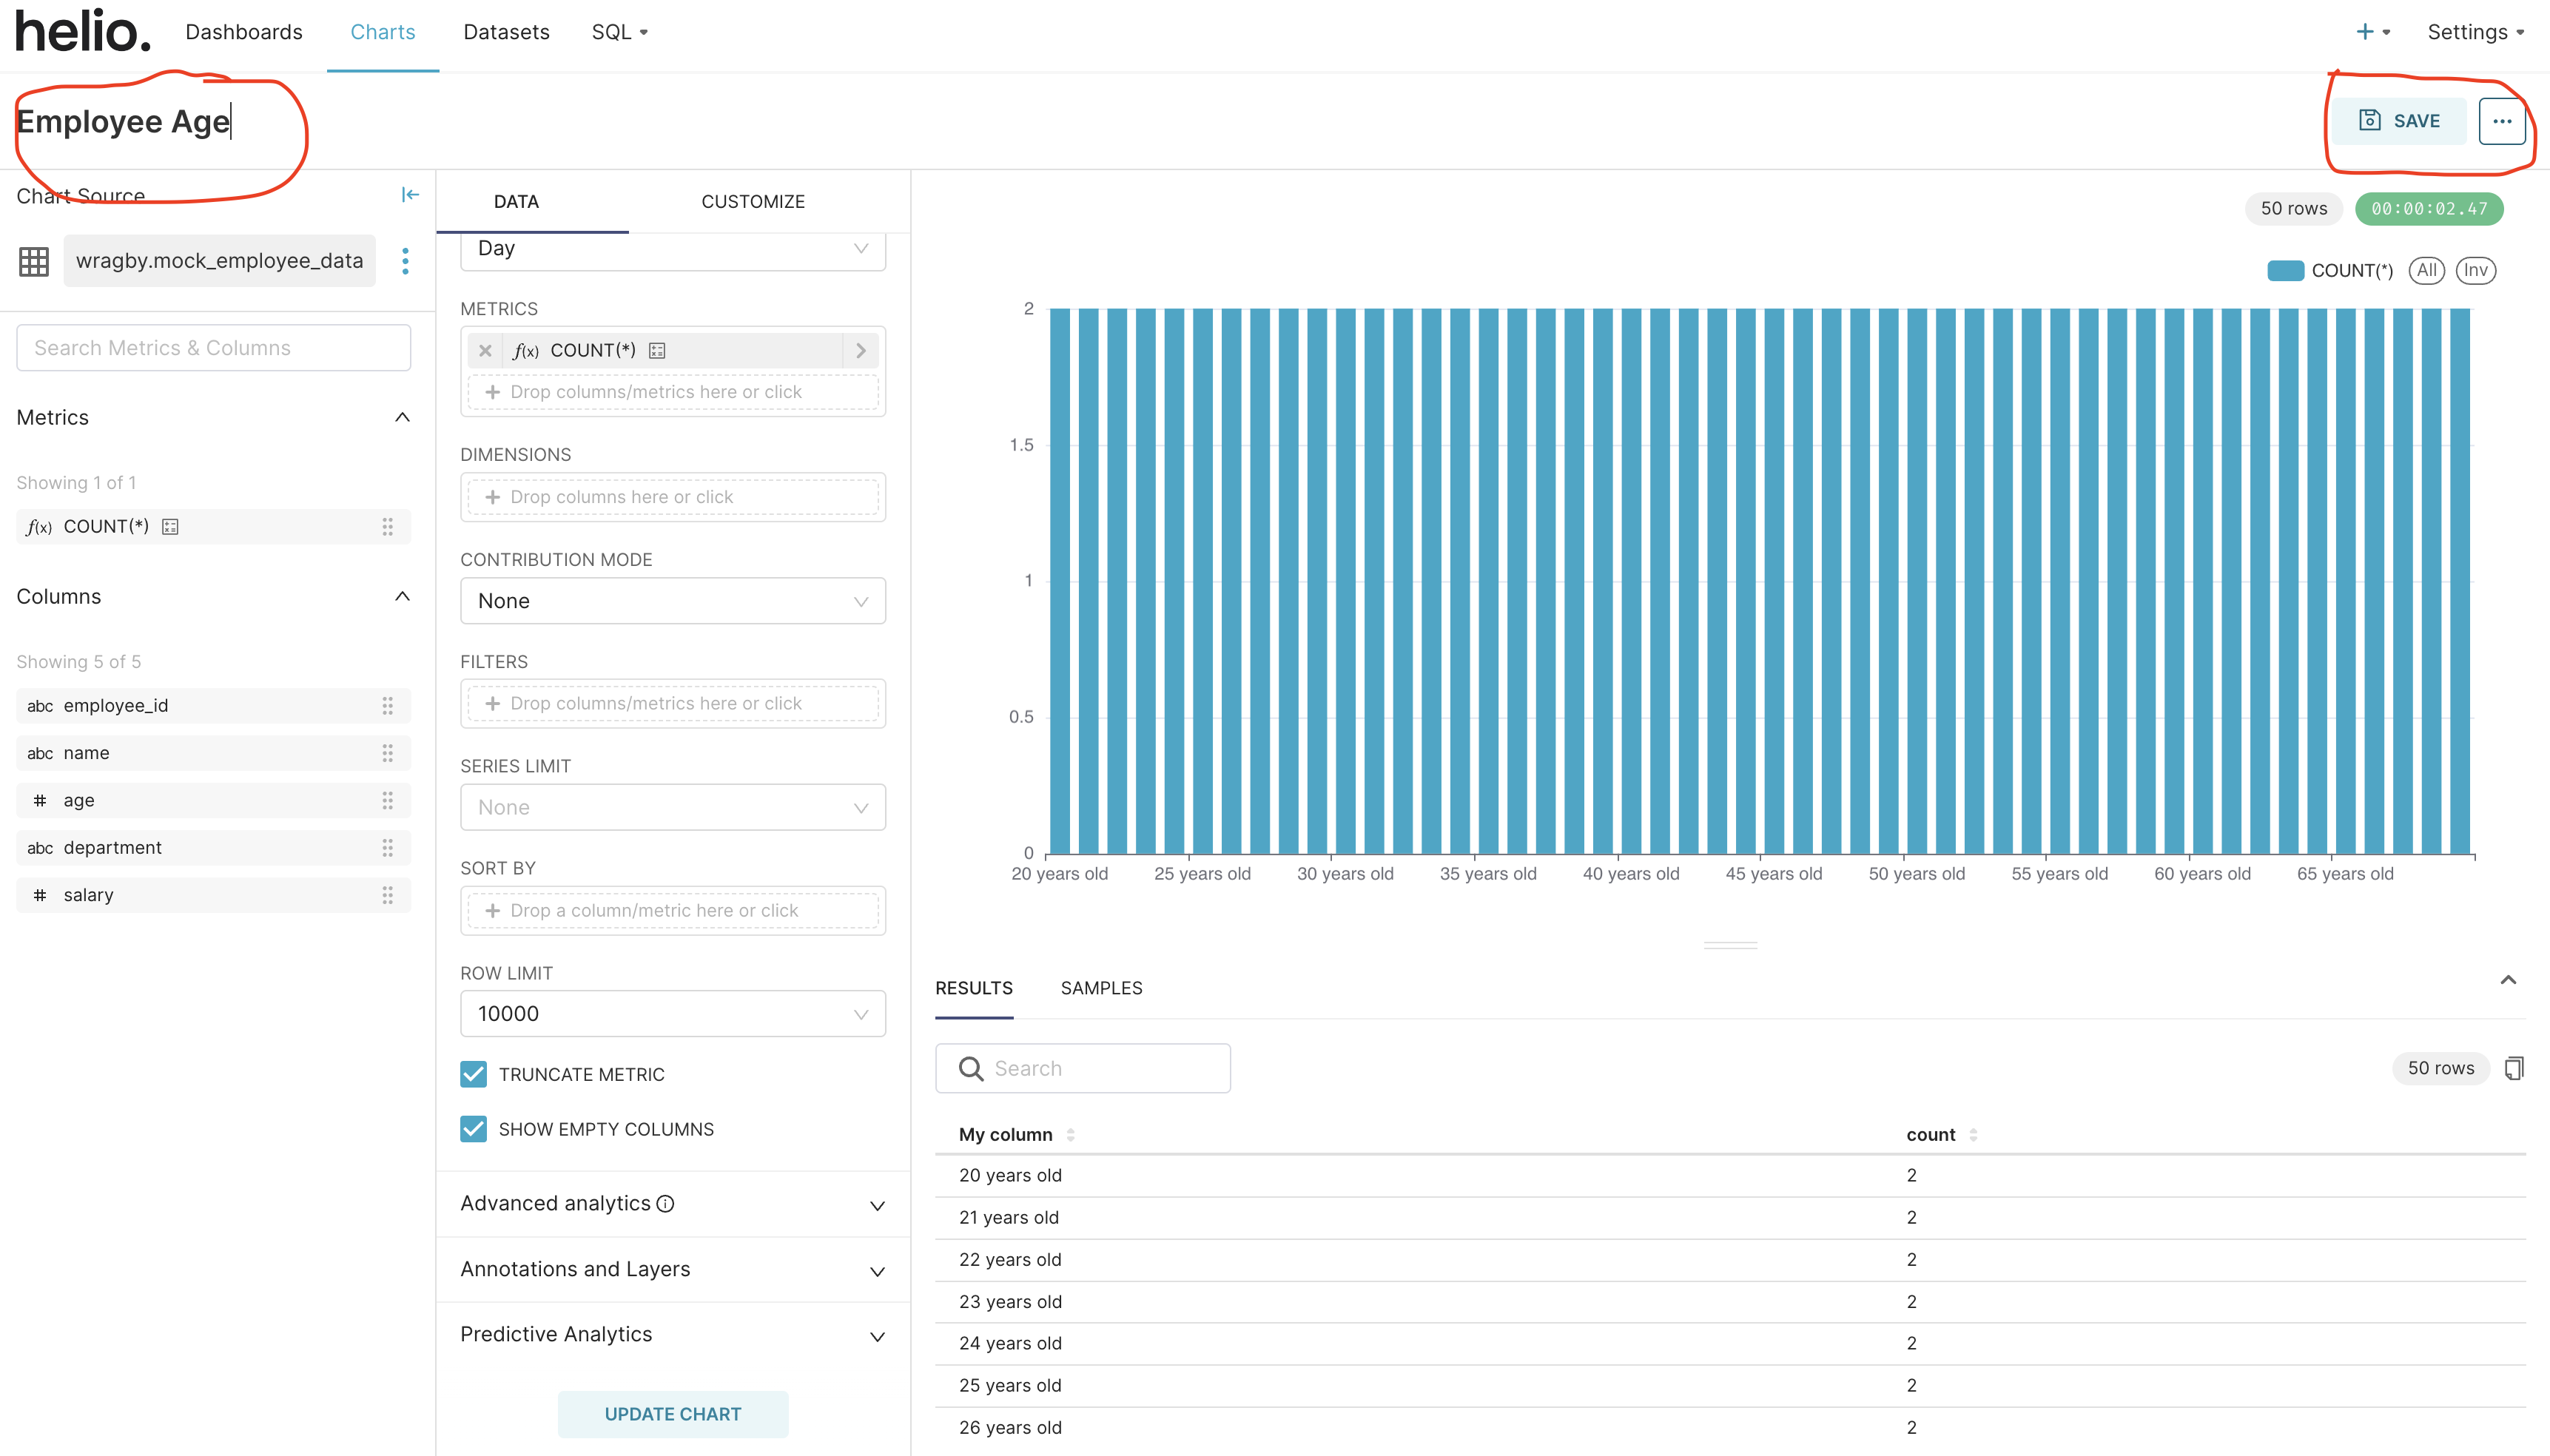
The save button opens a save modal where you can complete your chart creation.
List of Commands to Transform Data
Similar to how we convert column data above from one data type to another, there are other data transformations that we can carry out on Workhelio.
The following are commands to transform data in Workhelio:
Data Type Conversion
CAST(age AS STRING)
Where age is the data column and STRING is the data type you are converting to.
String Concatenation
CONCAT(CAST(age AS STRING), " years old")
Format Date
FORMAT_DATE('%x', `Order Date`)
Where Order Date is the data column for the date.
Format Time
FORMAT_TIME('%H:%M', PARSE_TIME('%I:%M %p', `ClockIn Time`))
Where ClockIn Time is the data column for the time.