Usage
Setup
Once again, welcome to Workhelio, a comprehensive tool for visualizing and analyzing your data. Follow these steps to get started quickly:
System Requirements
Launching the app
Account Creation
4. Creating a New Dashboard 5. 5. Creating Your First Report
System Requirements
Before you begin, ensure your system meets the following requirements:
Operating System:
Windows,MacOSorUbuntuInternet Connection: Stable broadband connection
Browser: Any reliable web browser
Launching the App
To launch the application, log onto www.[company_name].workhelio.com.
For instance, if your company name is "wragby", you will launch the application by going to this link.
>>> www.wragby.workhelio.com
The home screen looks like the image below when you launch:
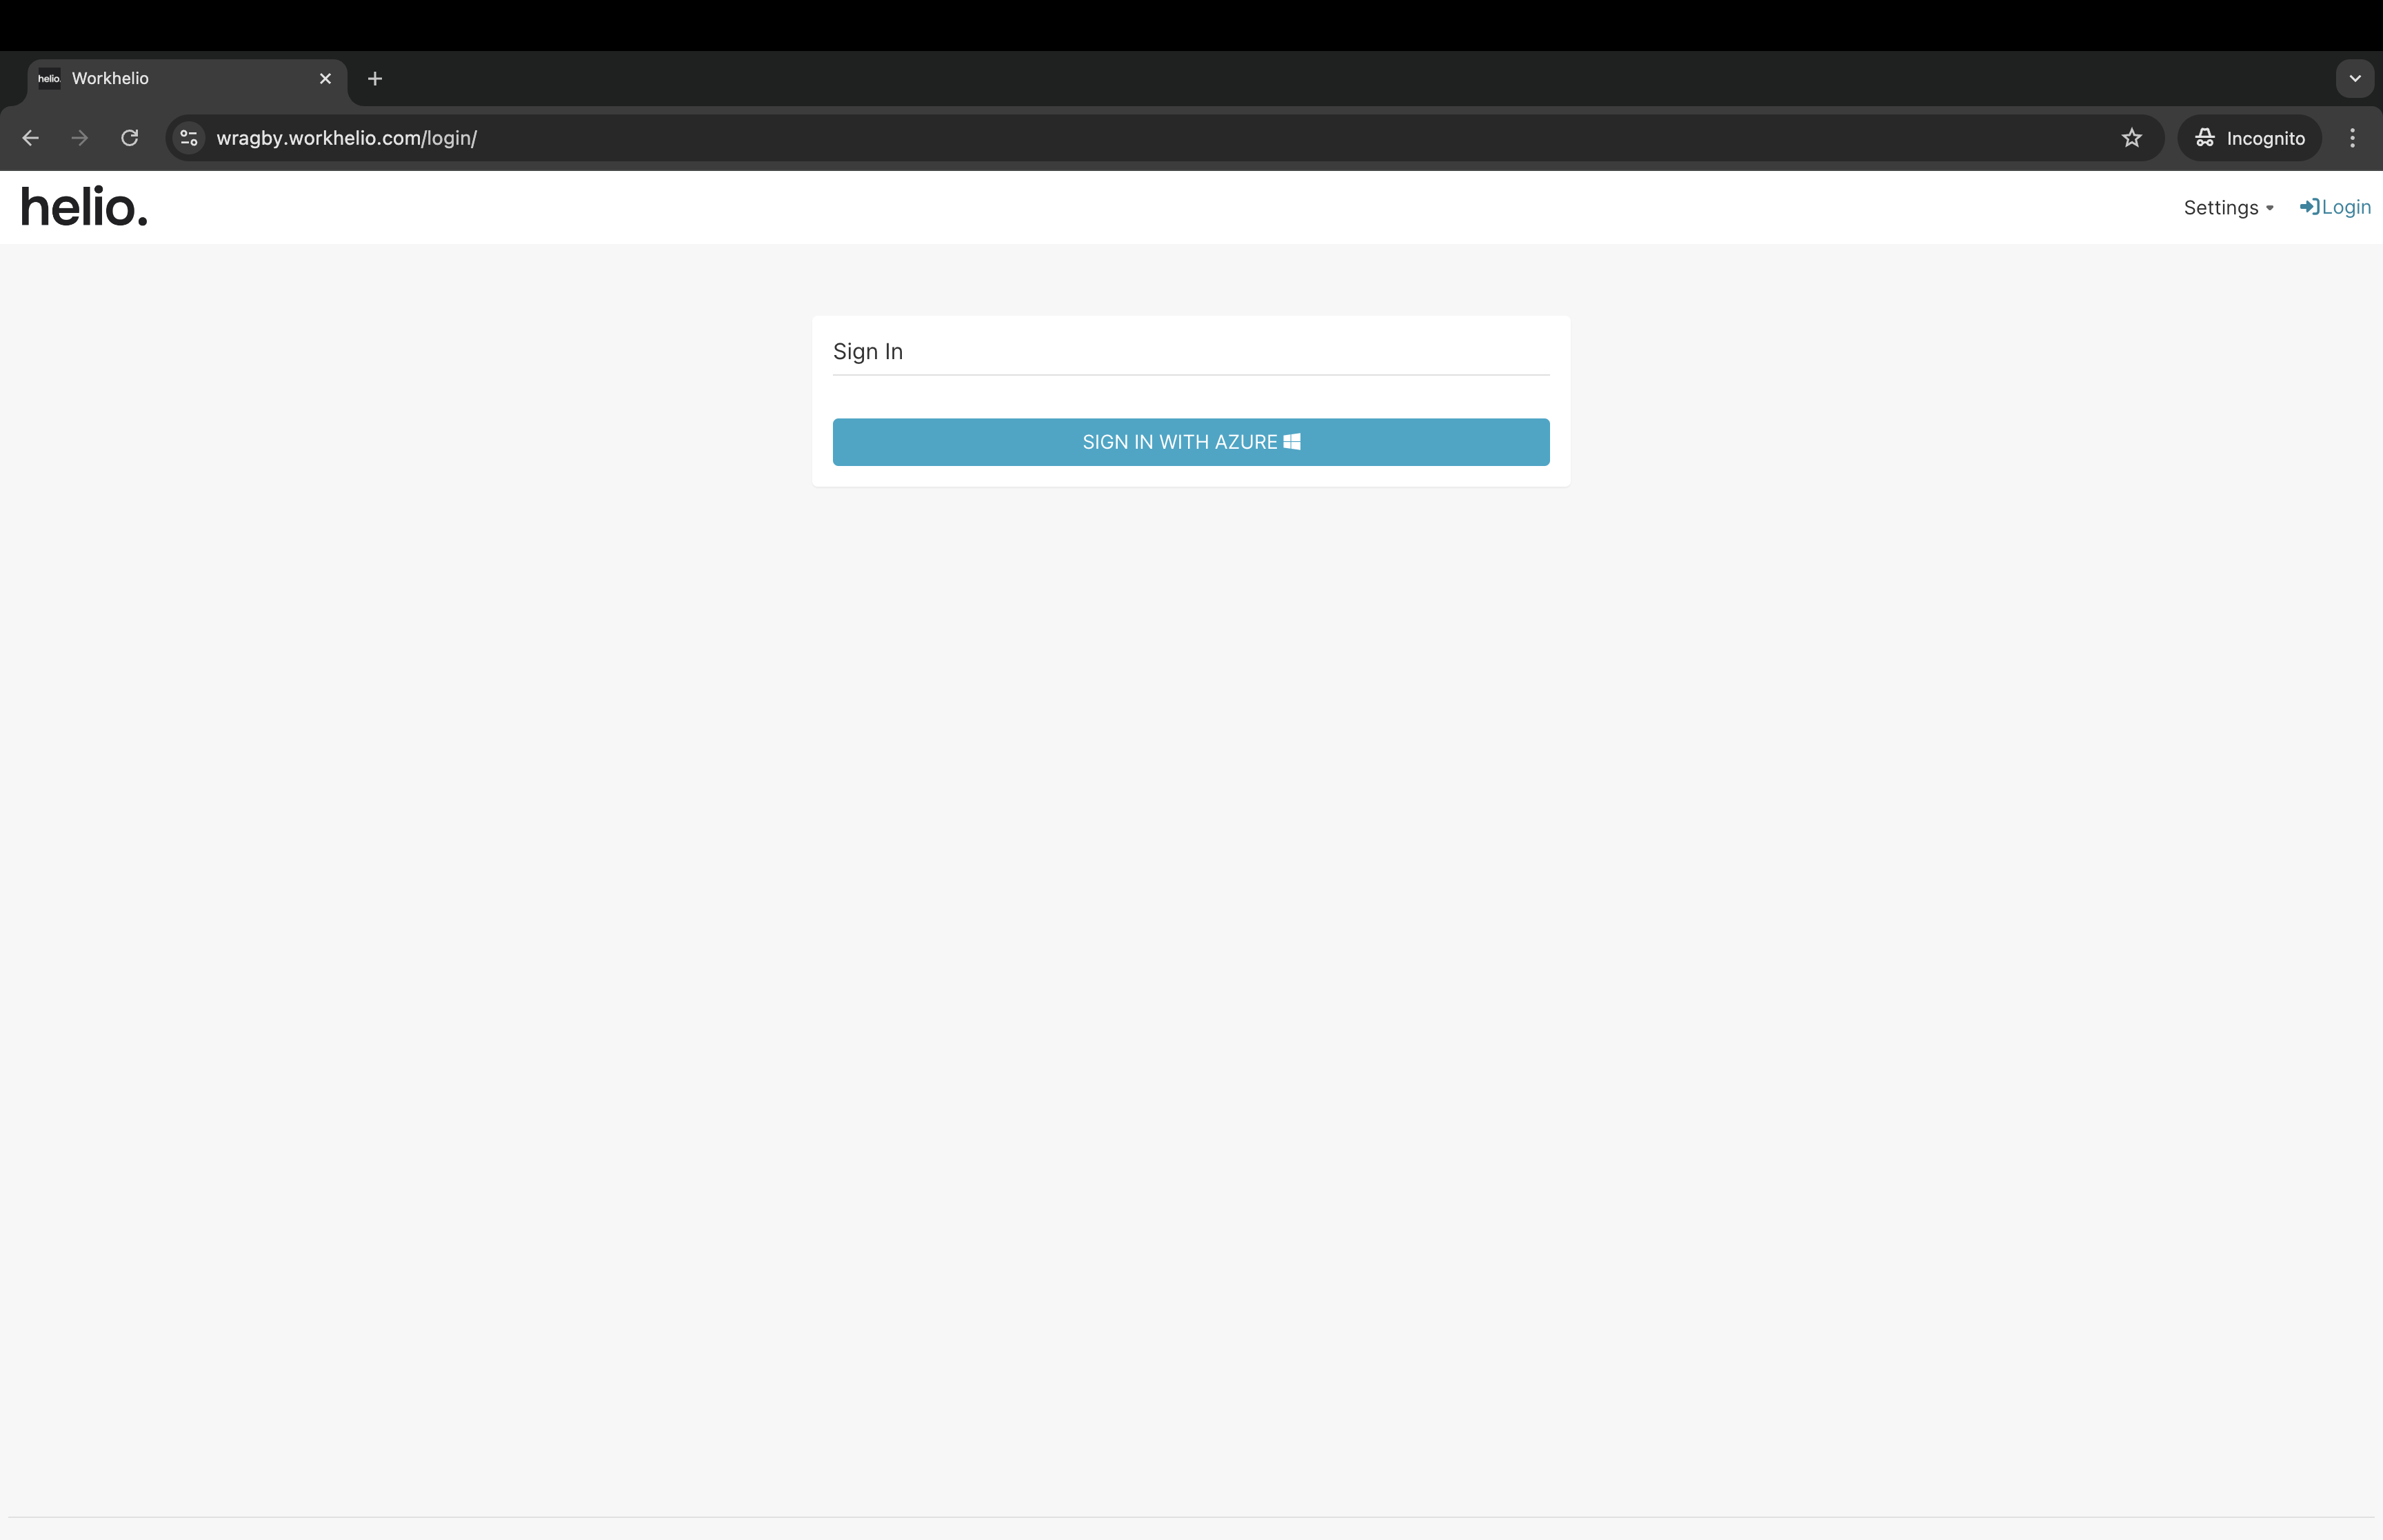
Account Creation
You’ll need to log in with your Microsoft account if you don’t mind. Thus, on the home screen, click on SIGN IN WITH AZURE and enter your Microsoft account login credentials on the page that follows here:

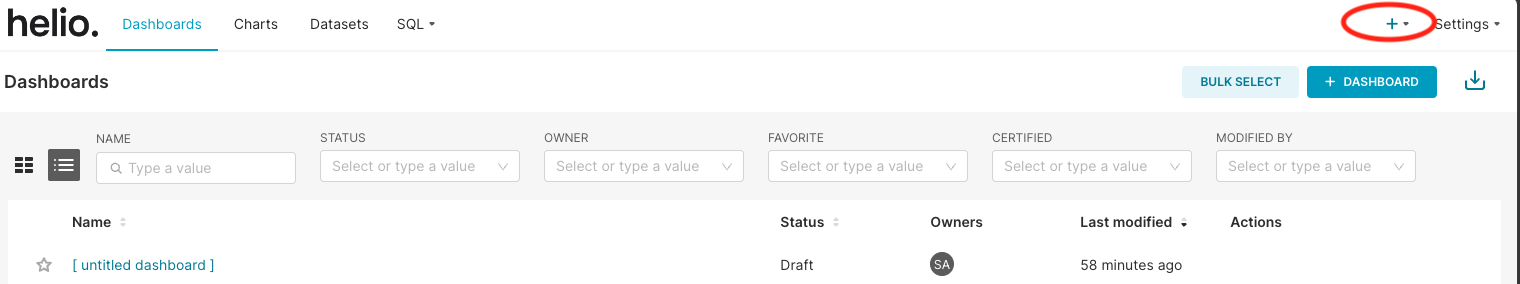
Creating a New Dashboard
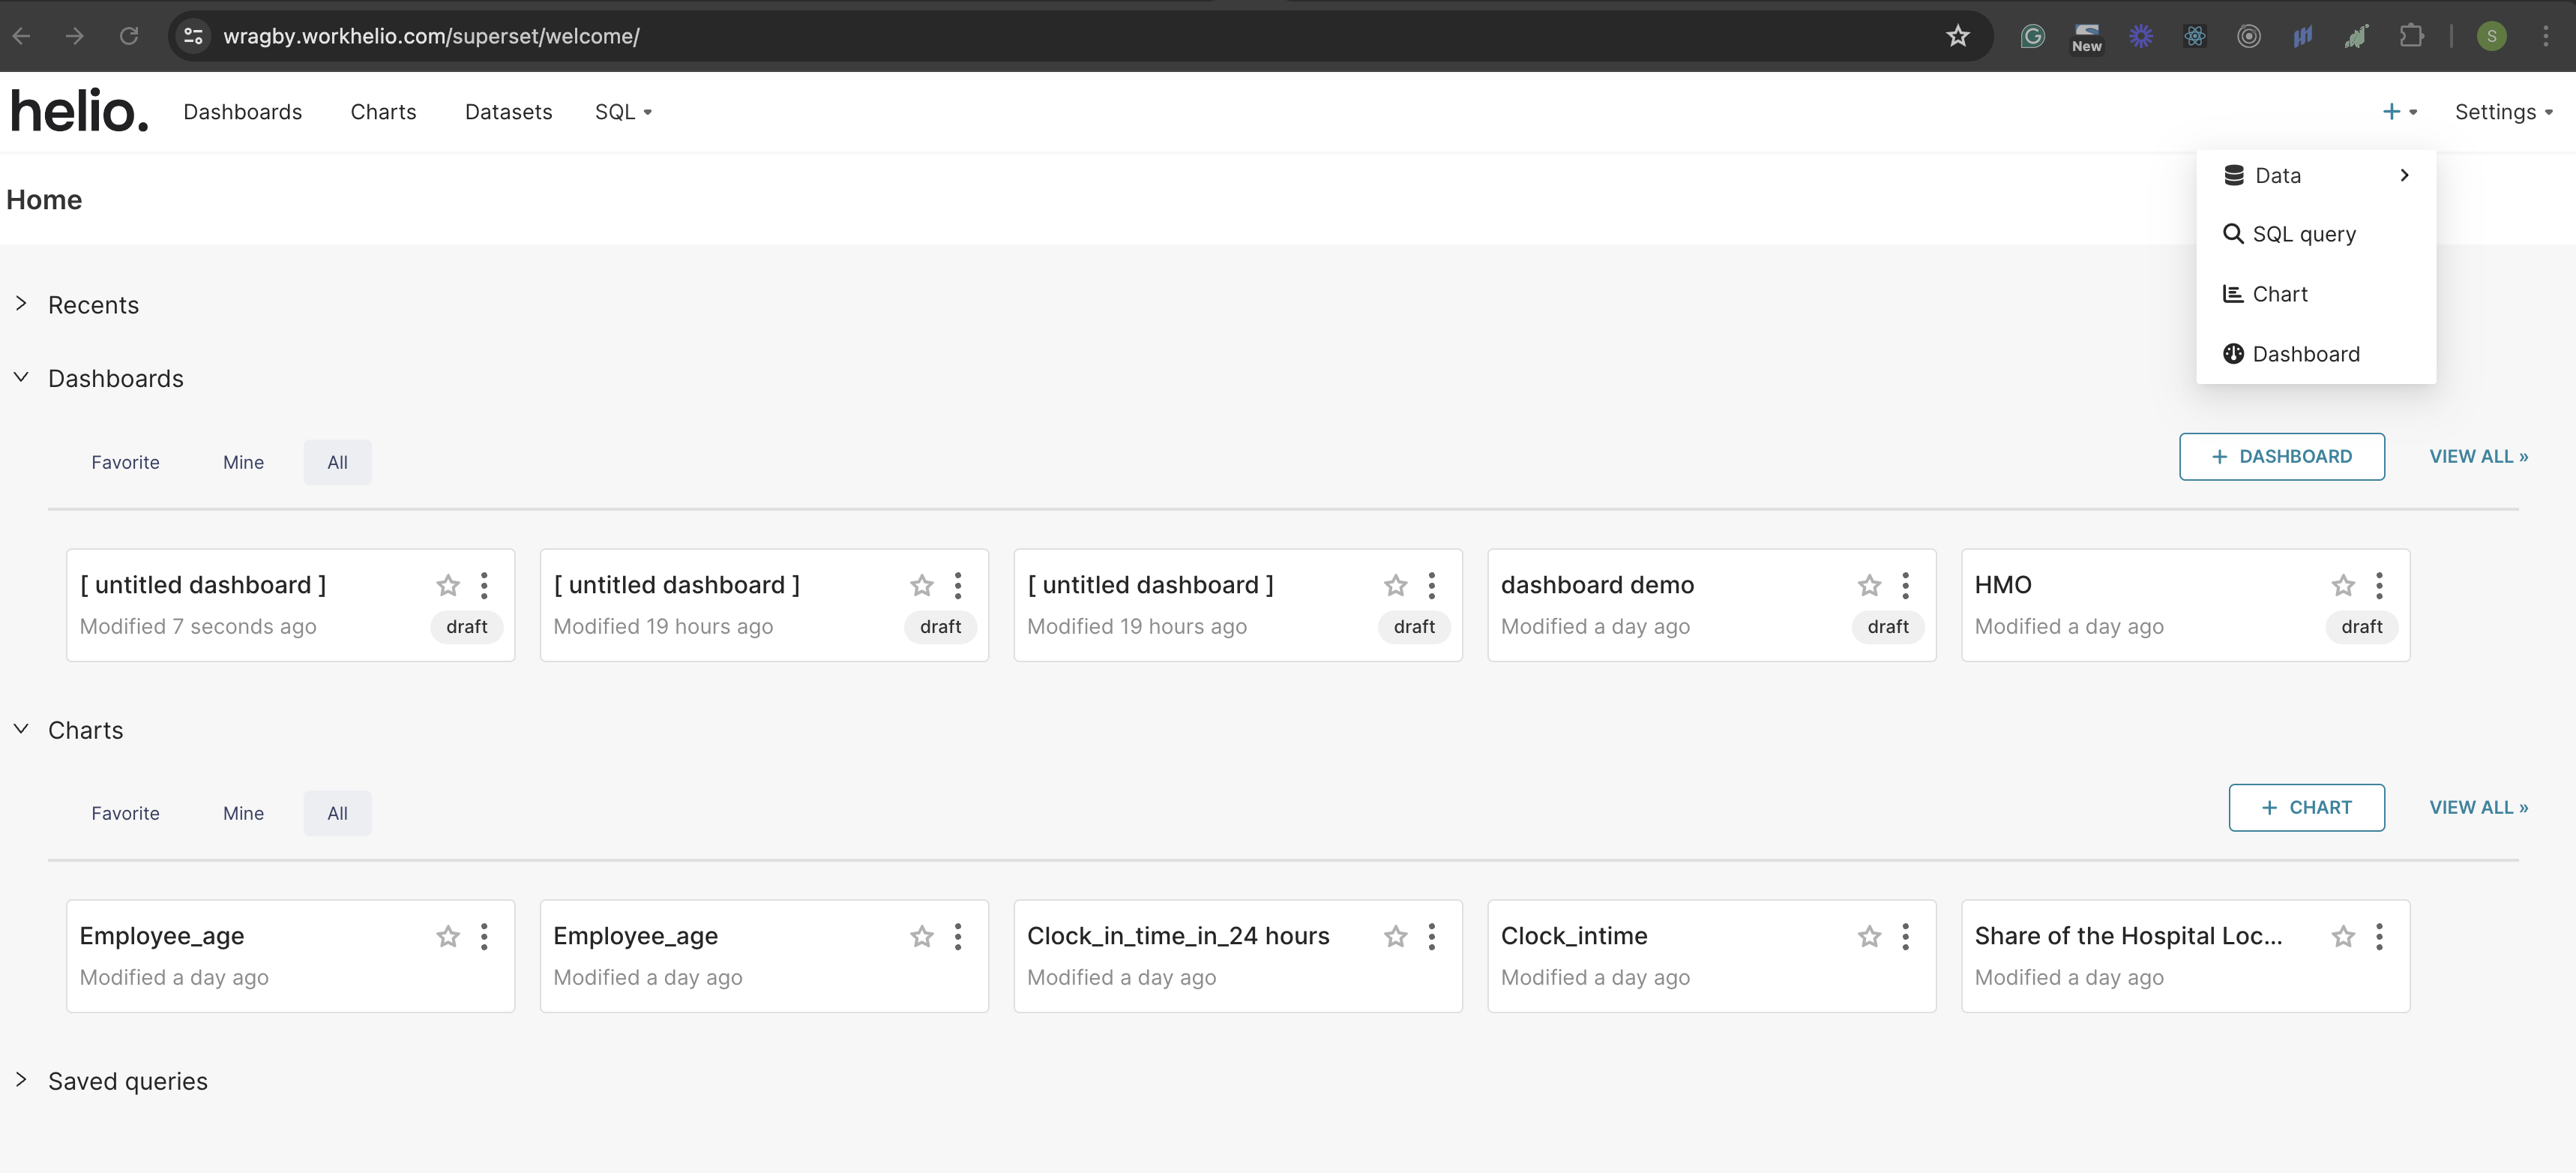
After signing in, you will create a new dashboard for your report. Click on the plus (+) button on the top right of the screen to create a dashboard.
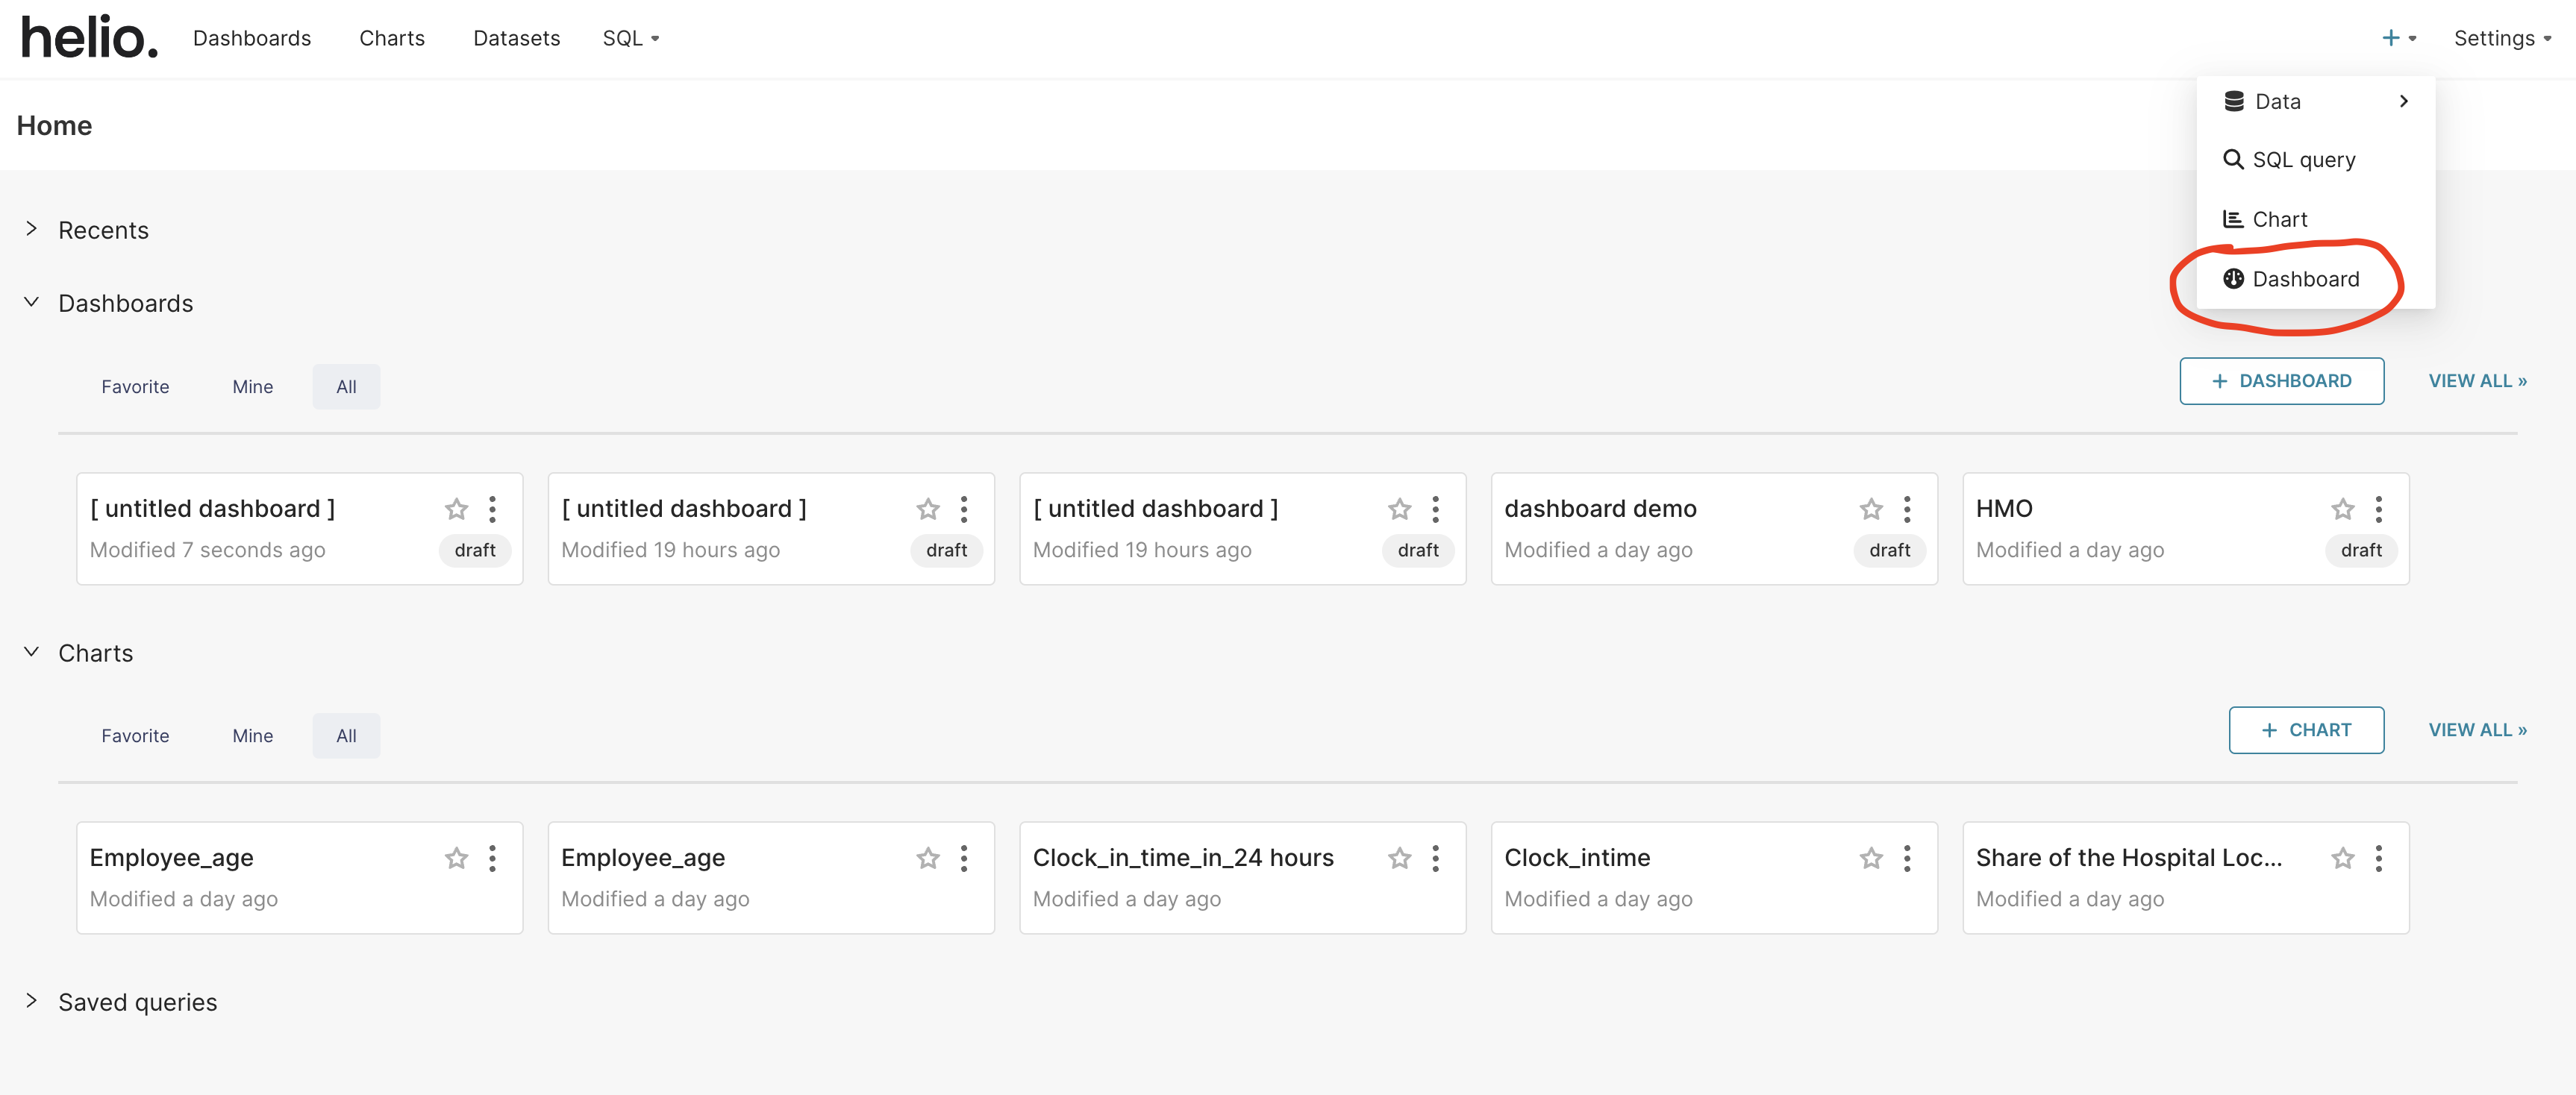
Select the “Dashboard” option inside the modal that appears after clicking the + button.
Name Your Dashboard
After selecting the dashboard, you will be taken to the dashboard page. On the top-left of the screen, edit the title of your dashboard to the title of your choice.
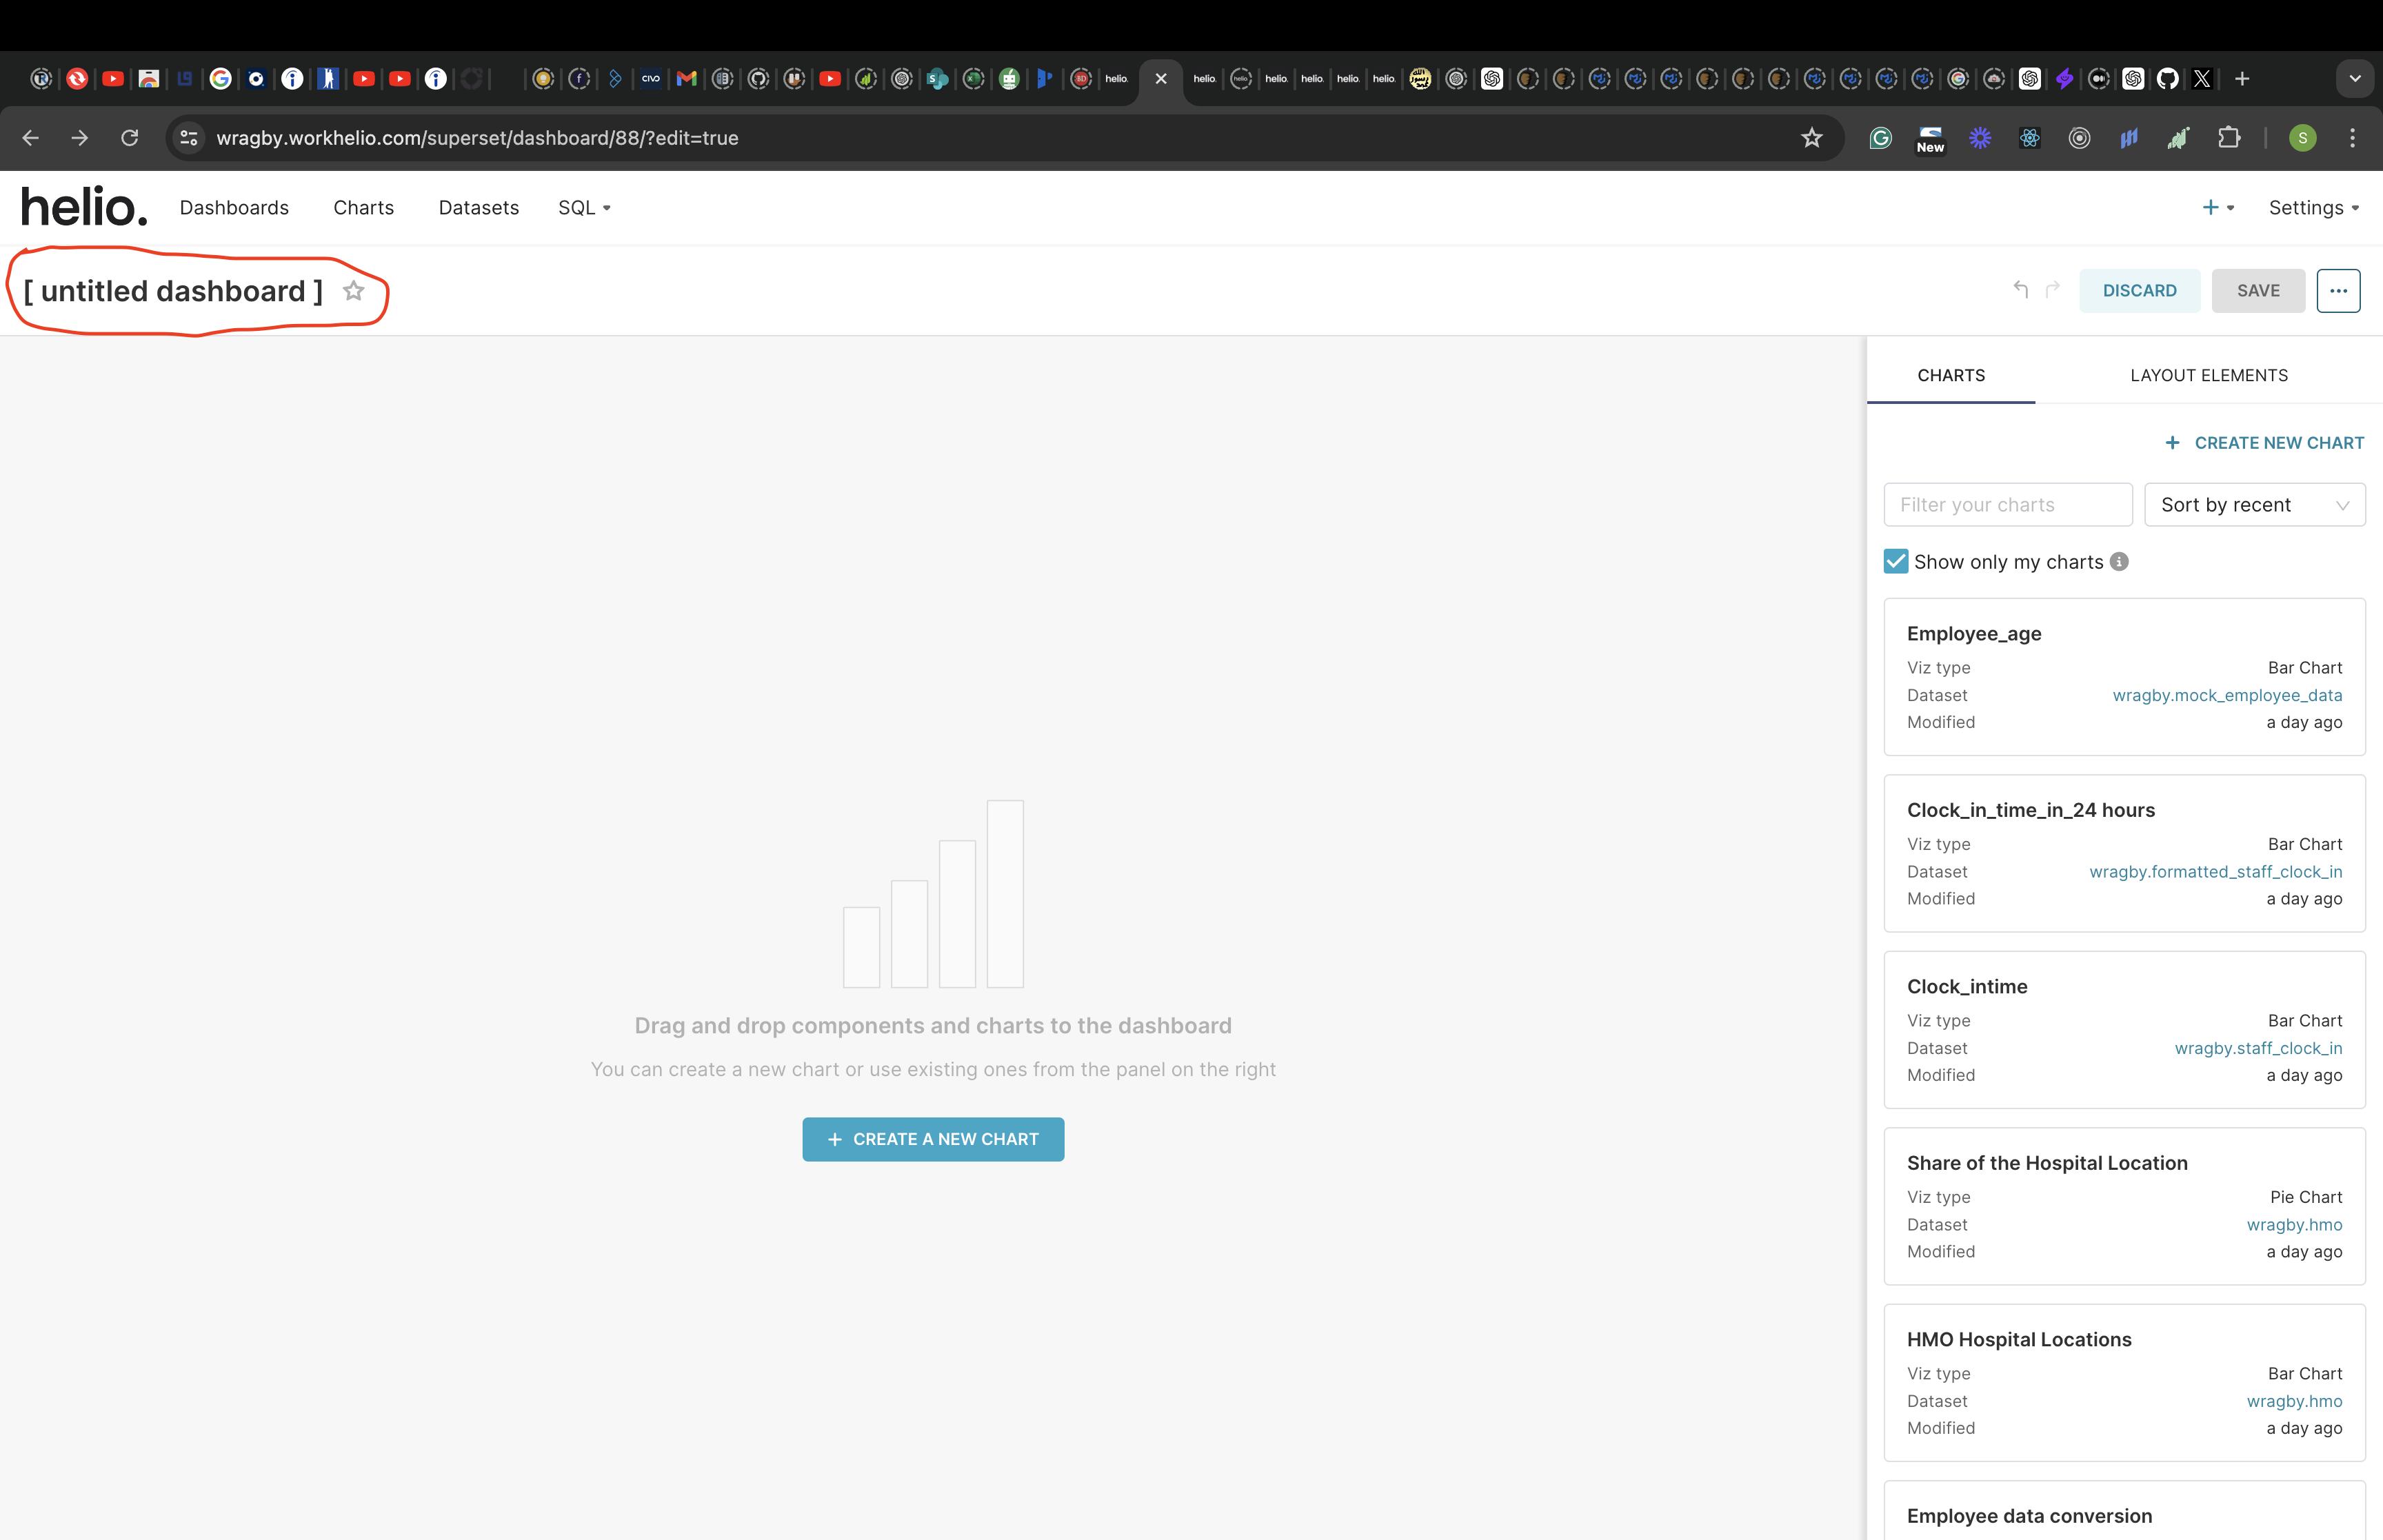
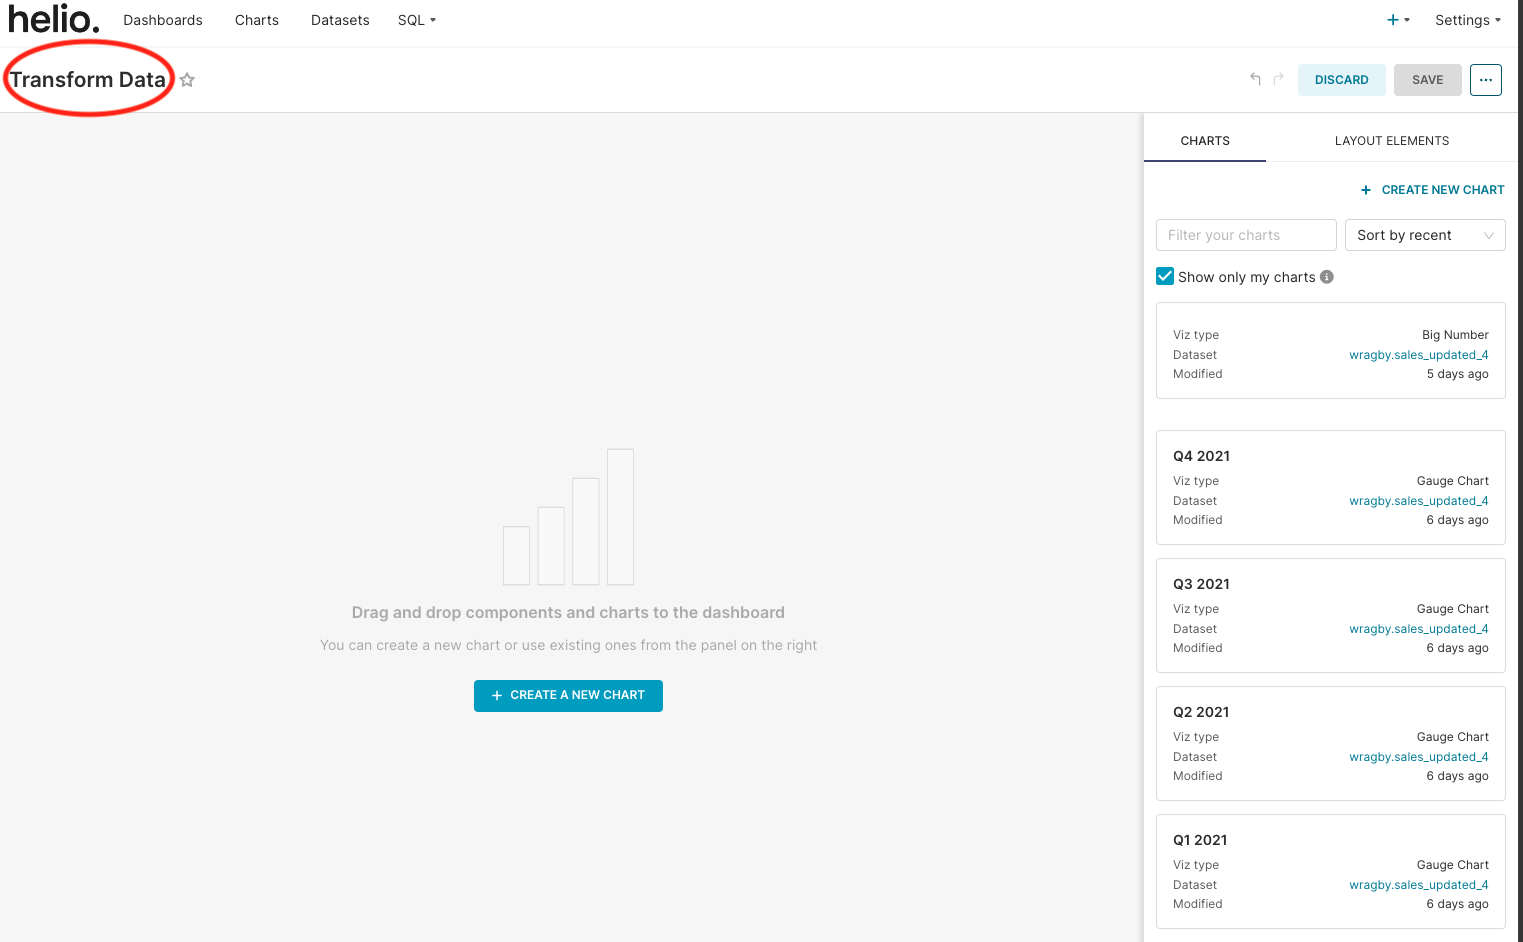
Let’s name our dashboard “Transform Data”. Click the save button on the top-right of the screen to save the title.
Edit the Dashboard to Create a New Chart
After saving the dashboard name, click the edit dashboard button to create a new chart.
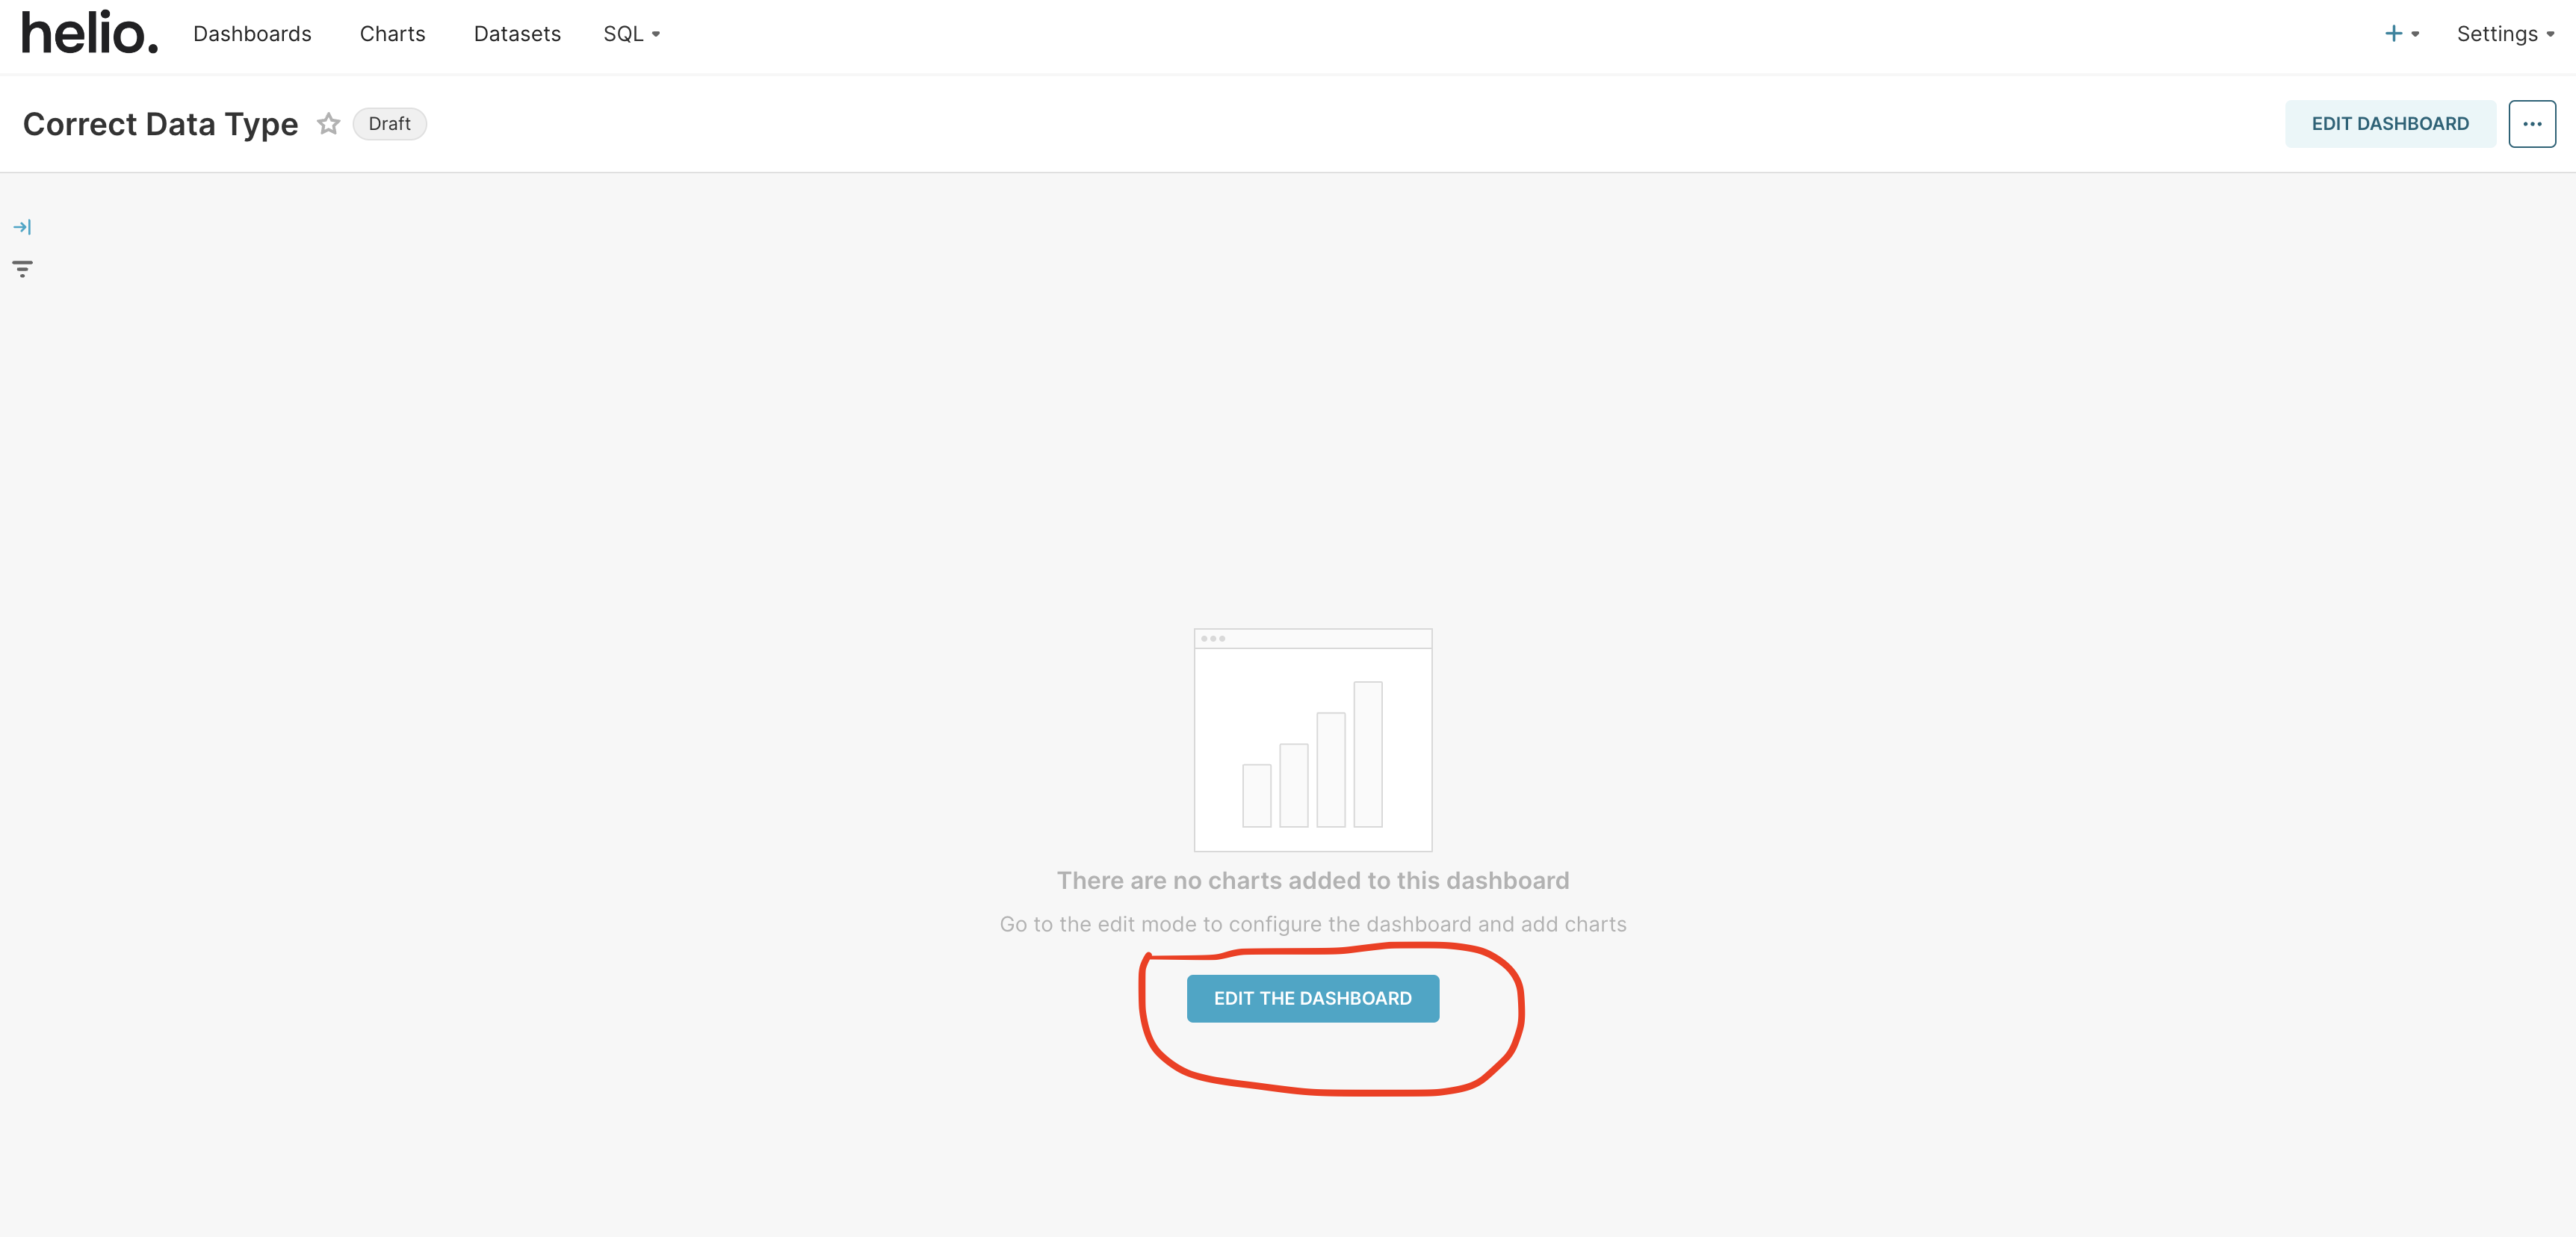
The page will change and you will see a new button - “CREATE A NEW CHART”, click on it.

This will take you to a new page where you will select the chart type you want and build your preferred dashboard chart.
Choose Your Dataset and Chart Type
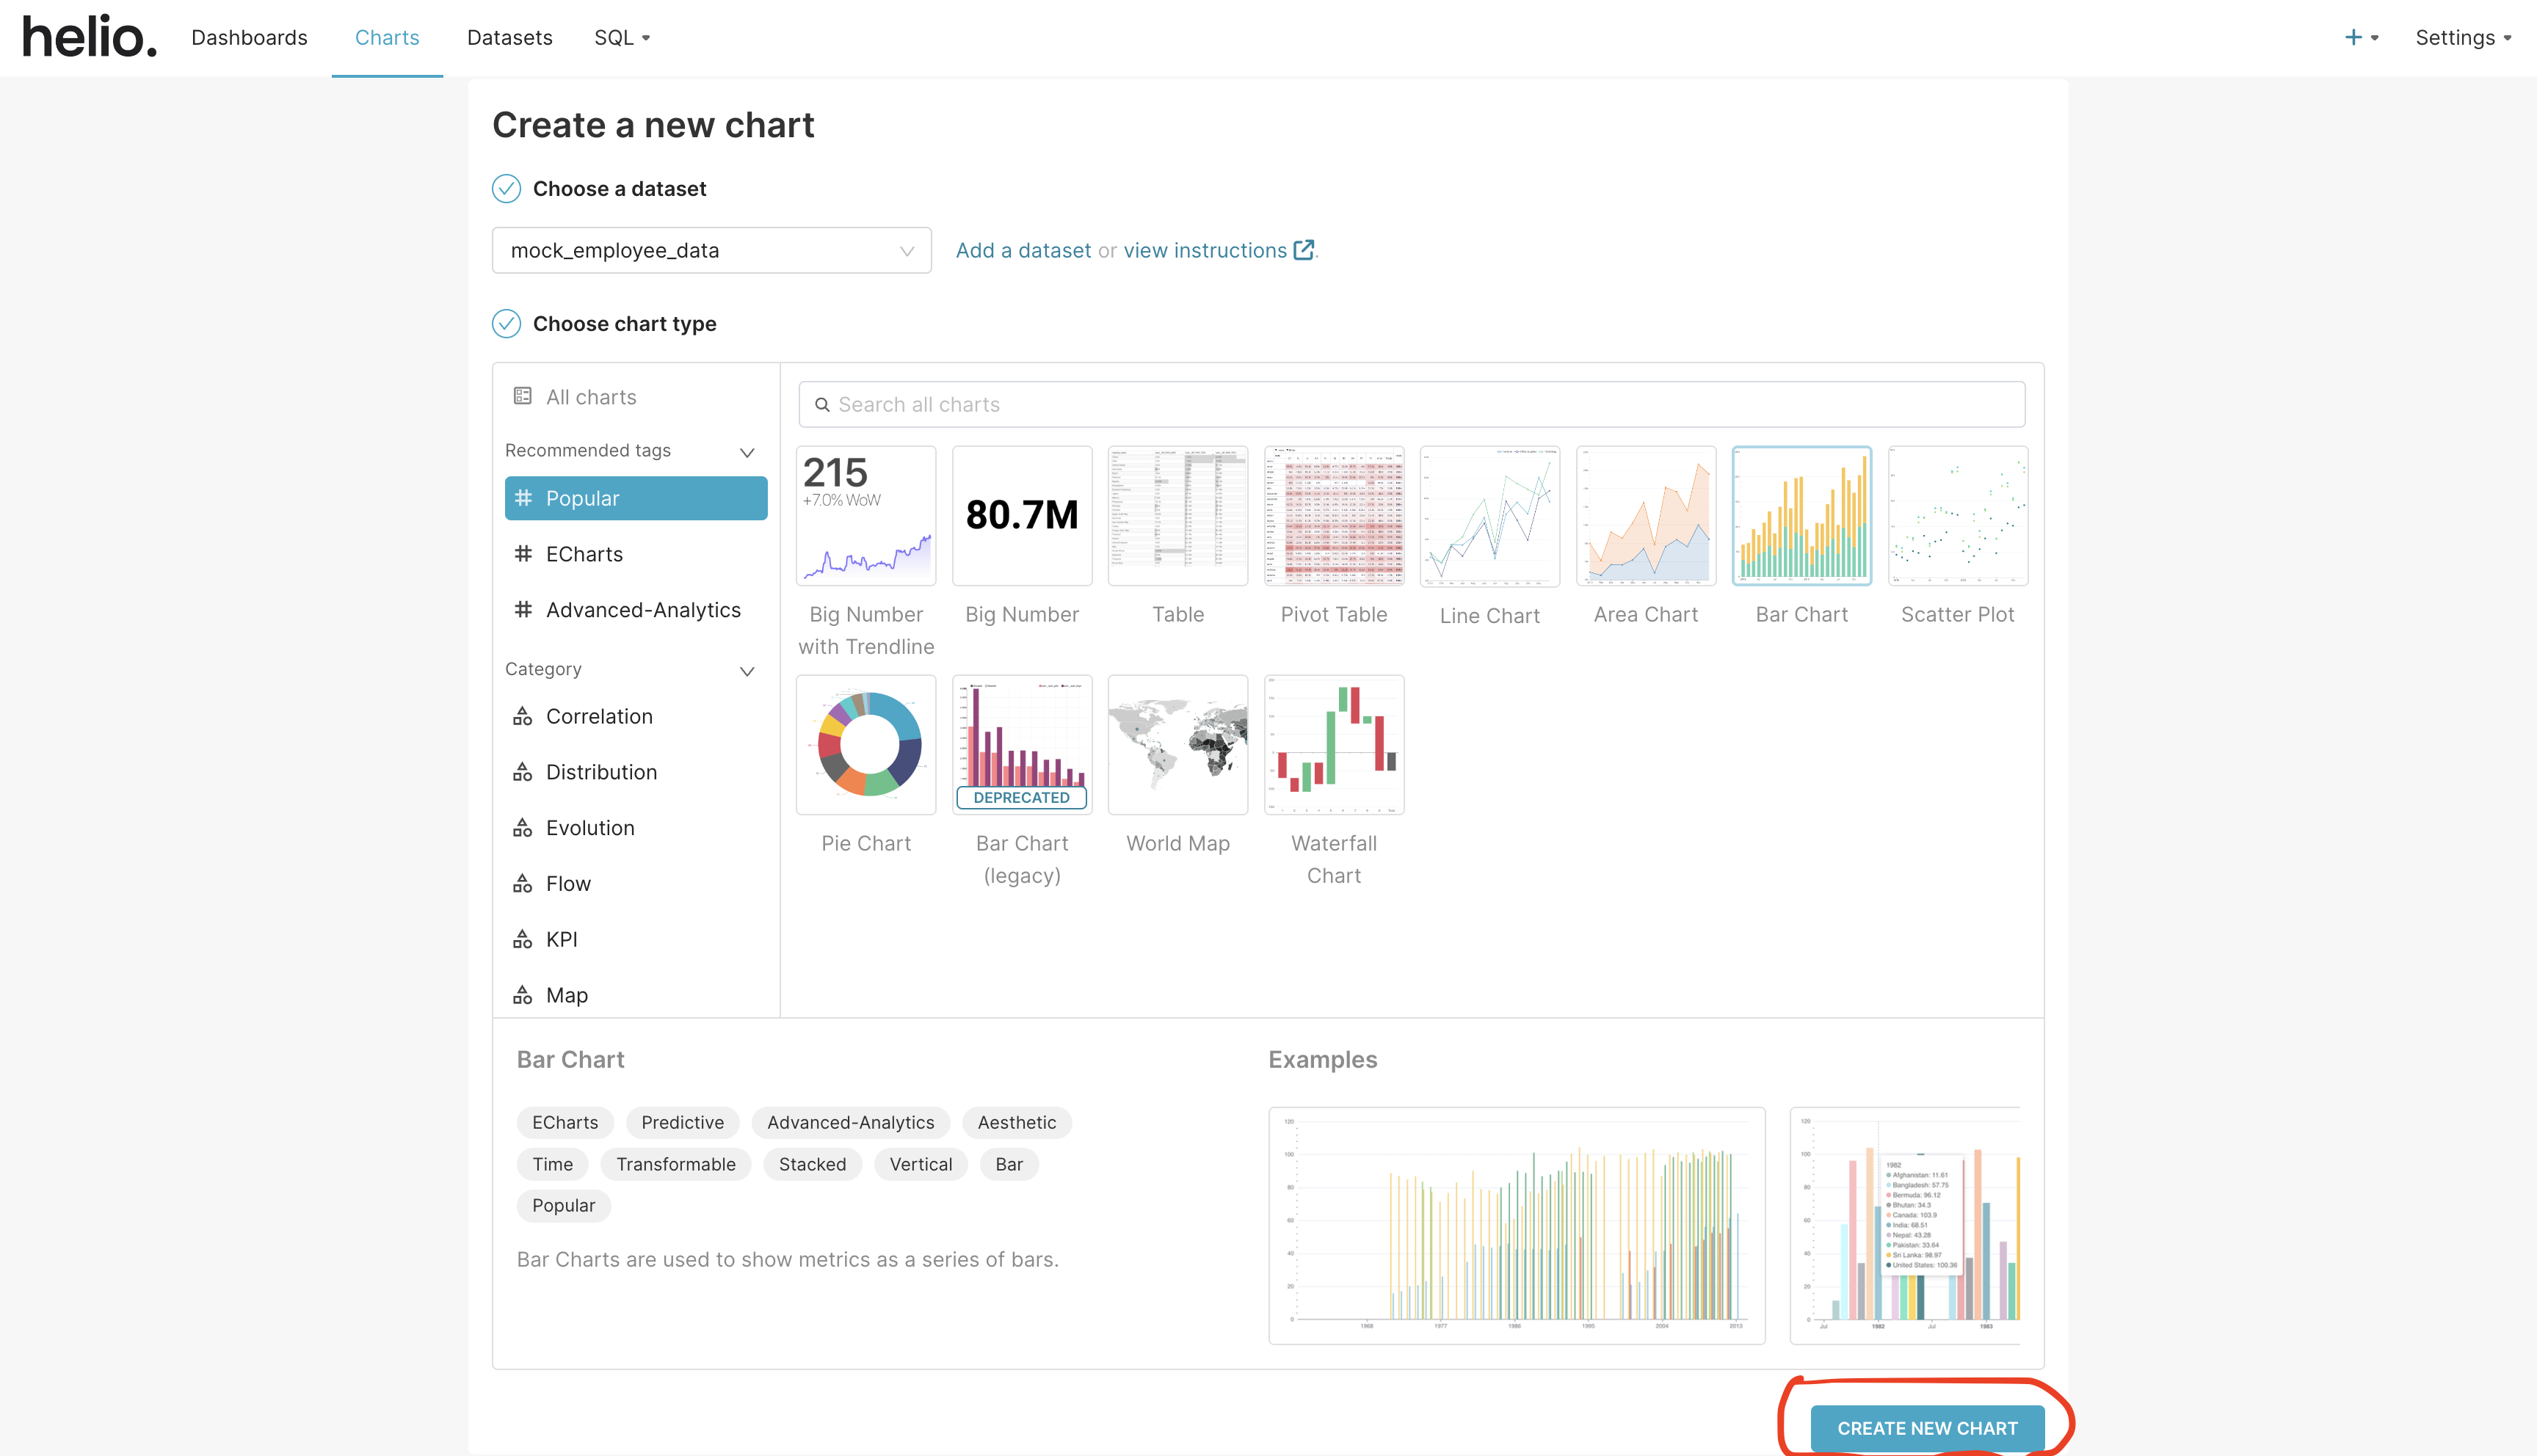
Choose a dataset to work with among the list of datasets in the select input options. We are going to select mock_employee_data as our option in this example.
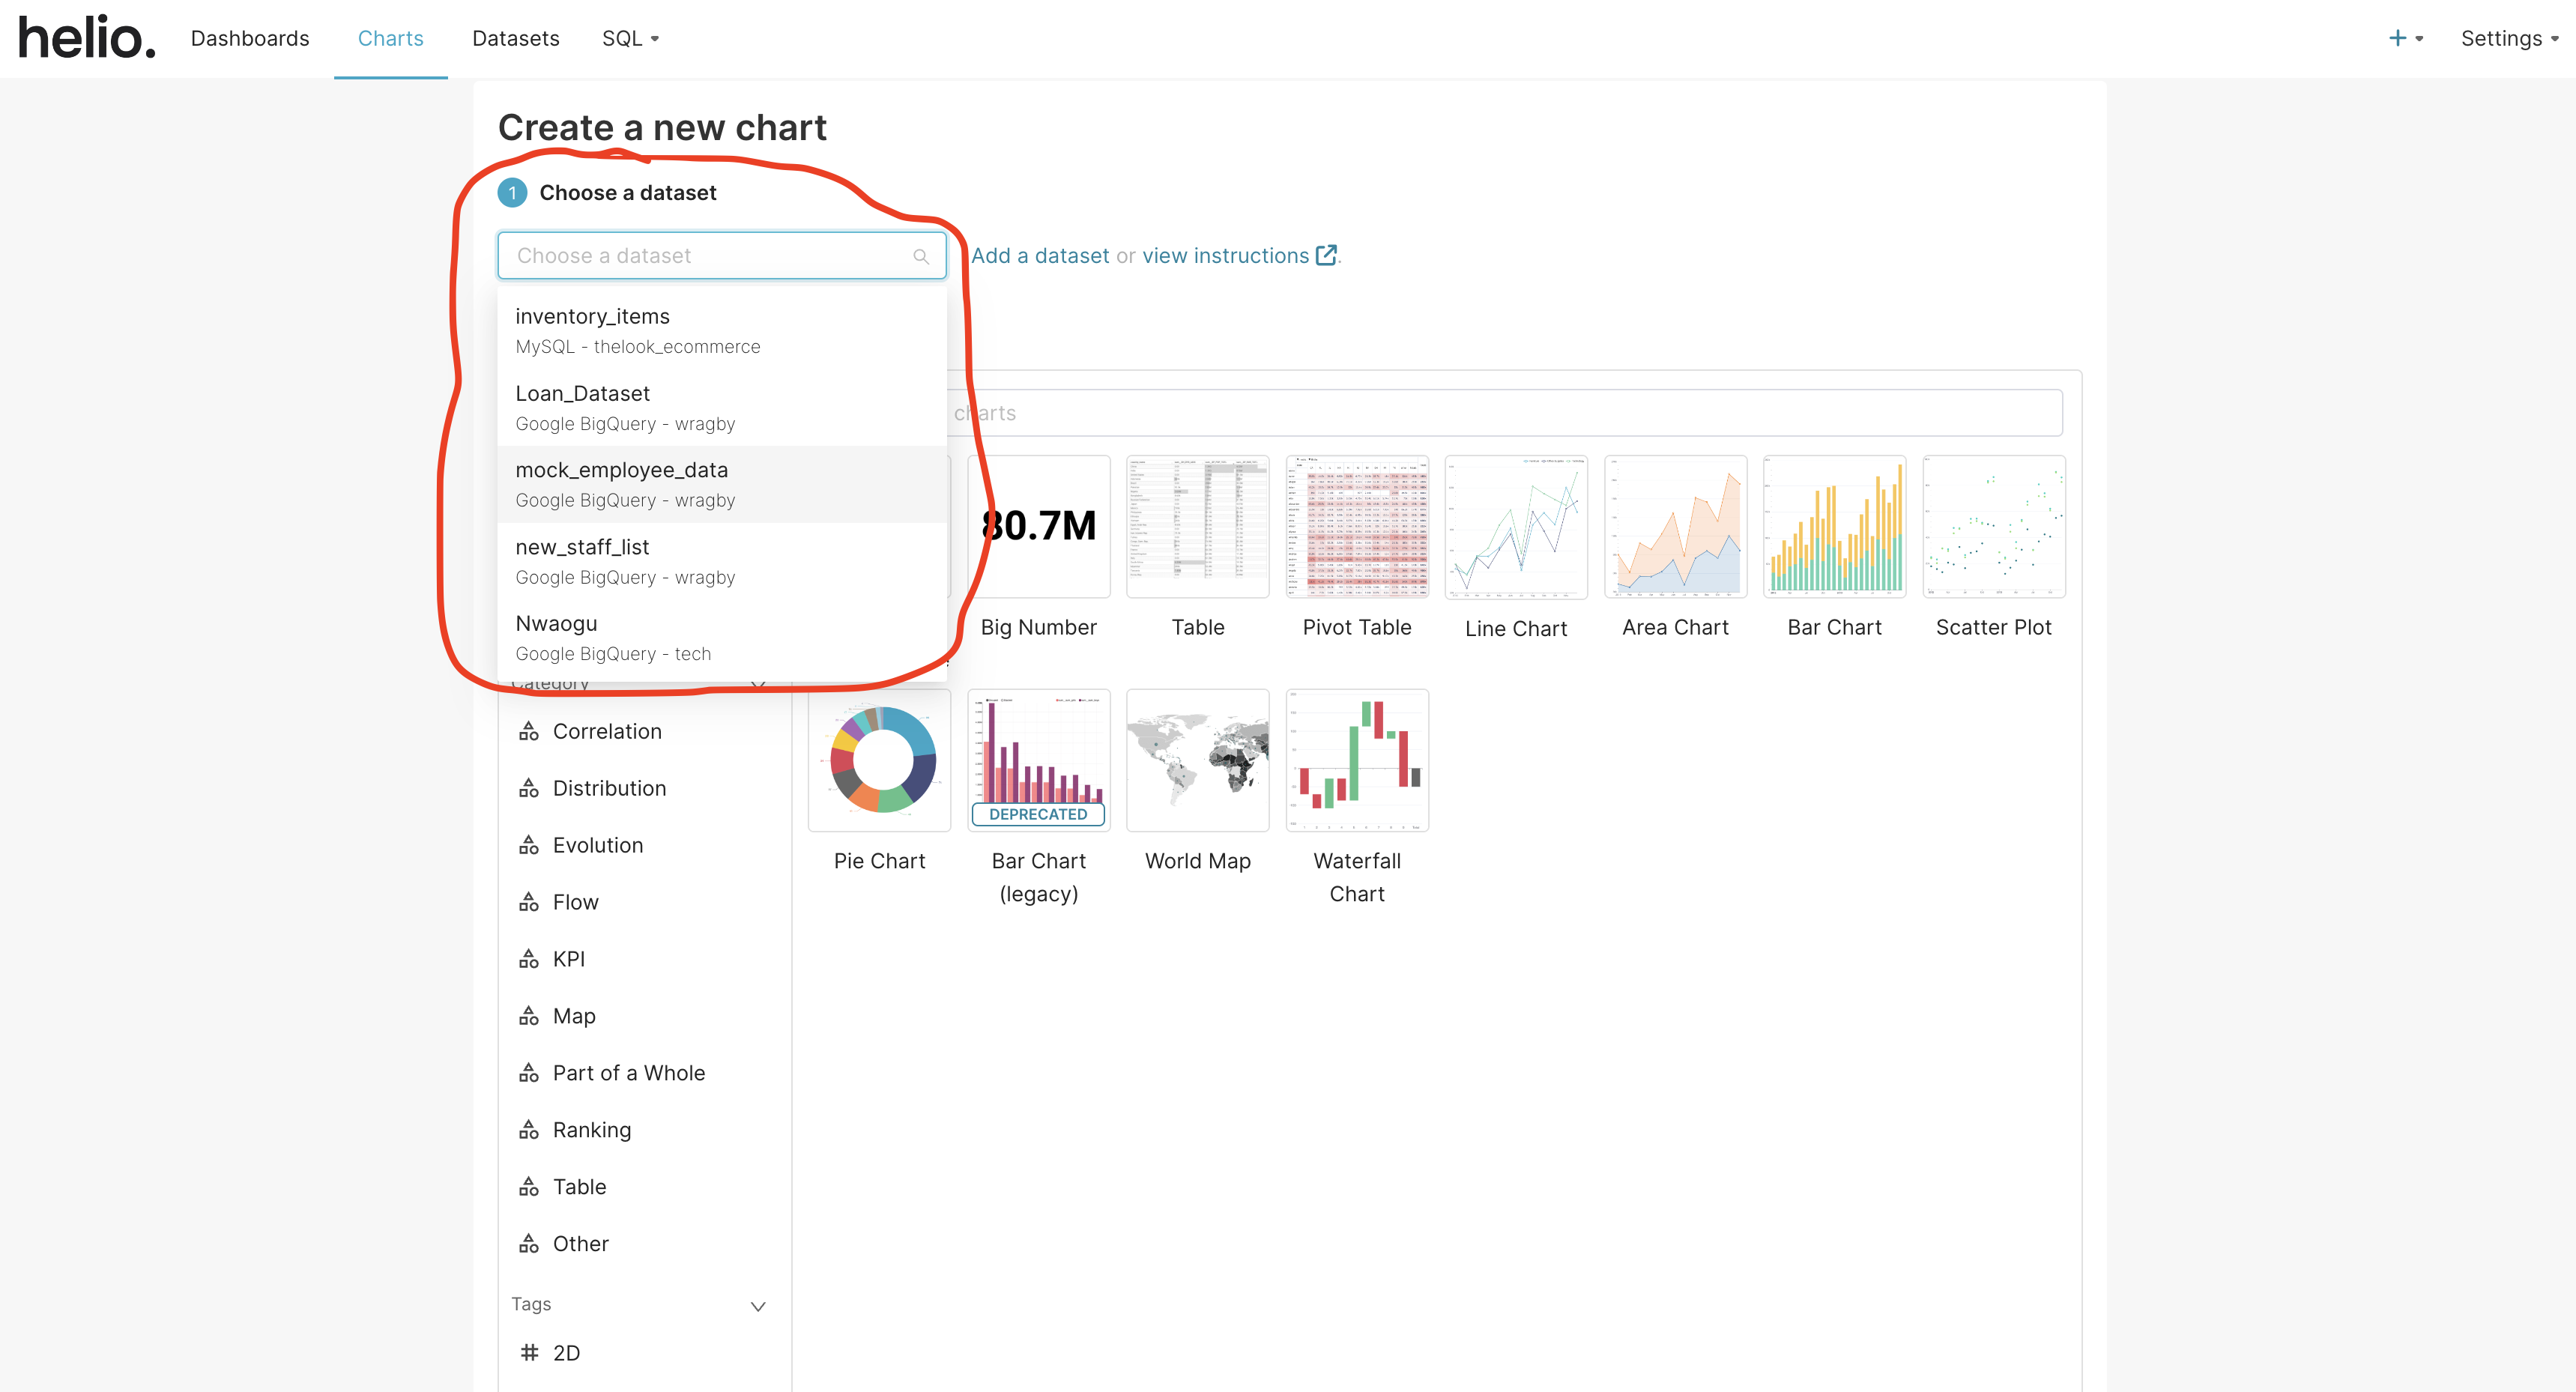
Select the chart type. In this example, we are going to select the bar chart under the list of popular charts.
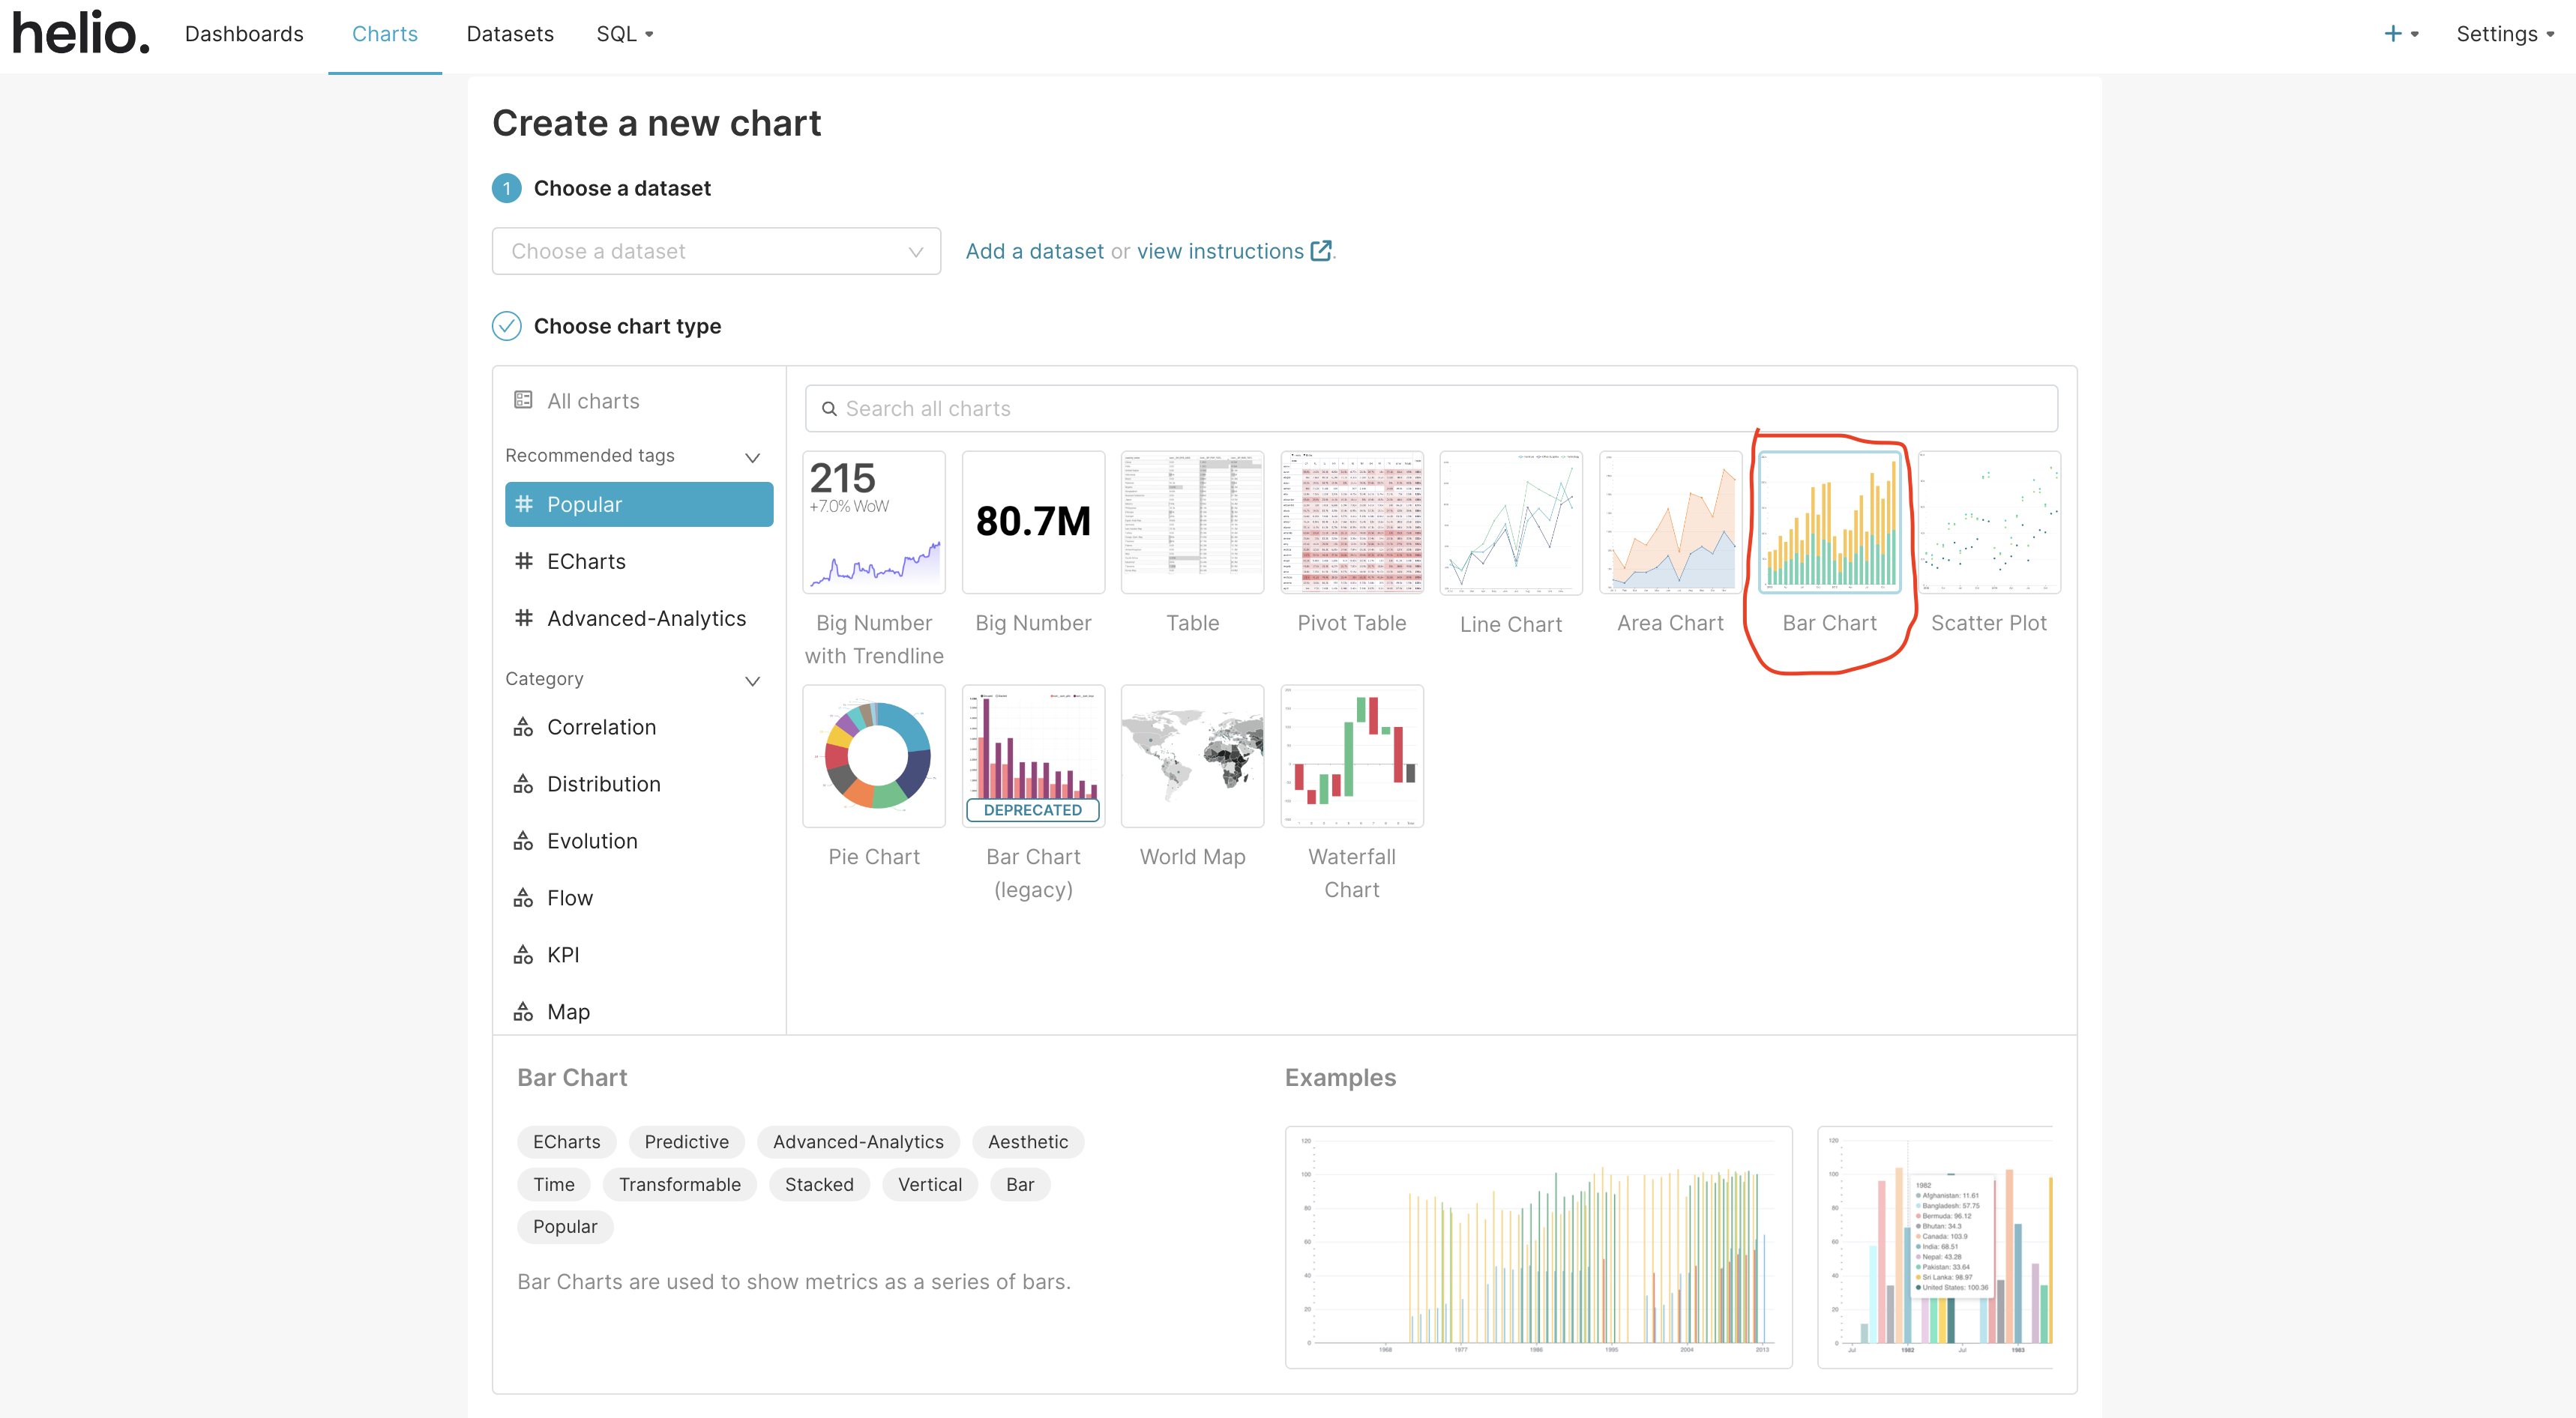
When you are done, click on the “CREATE NEW CHART” button at the bottom of the page.
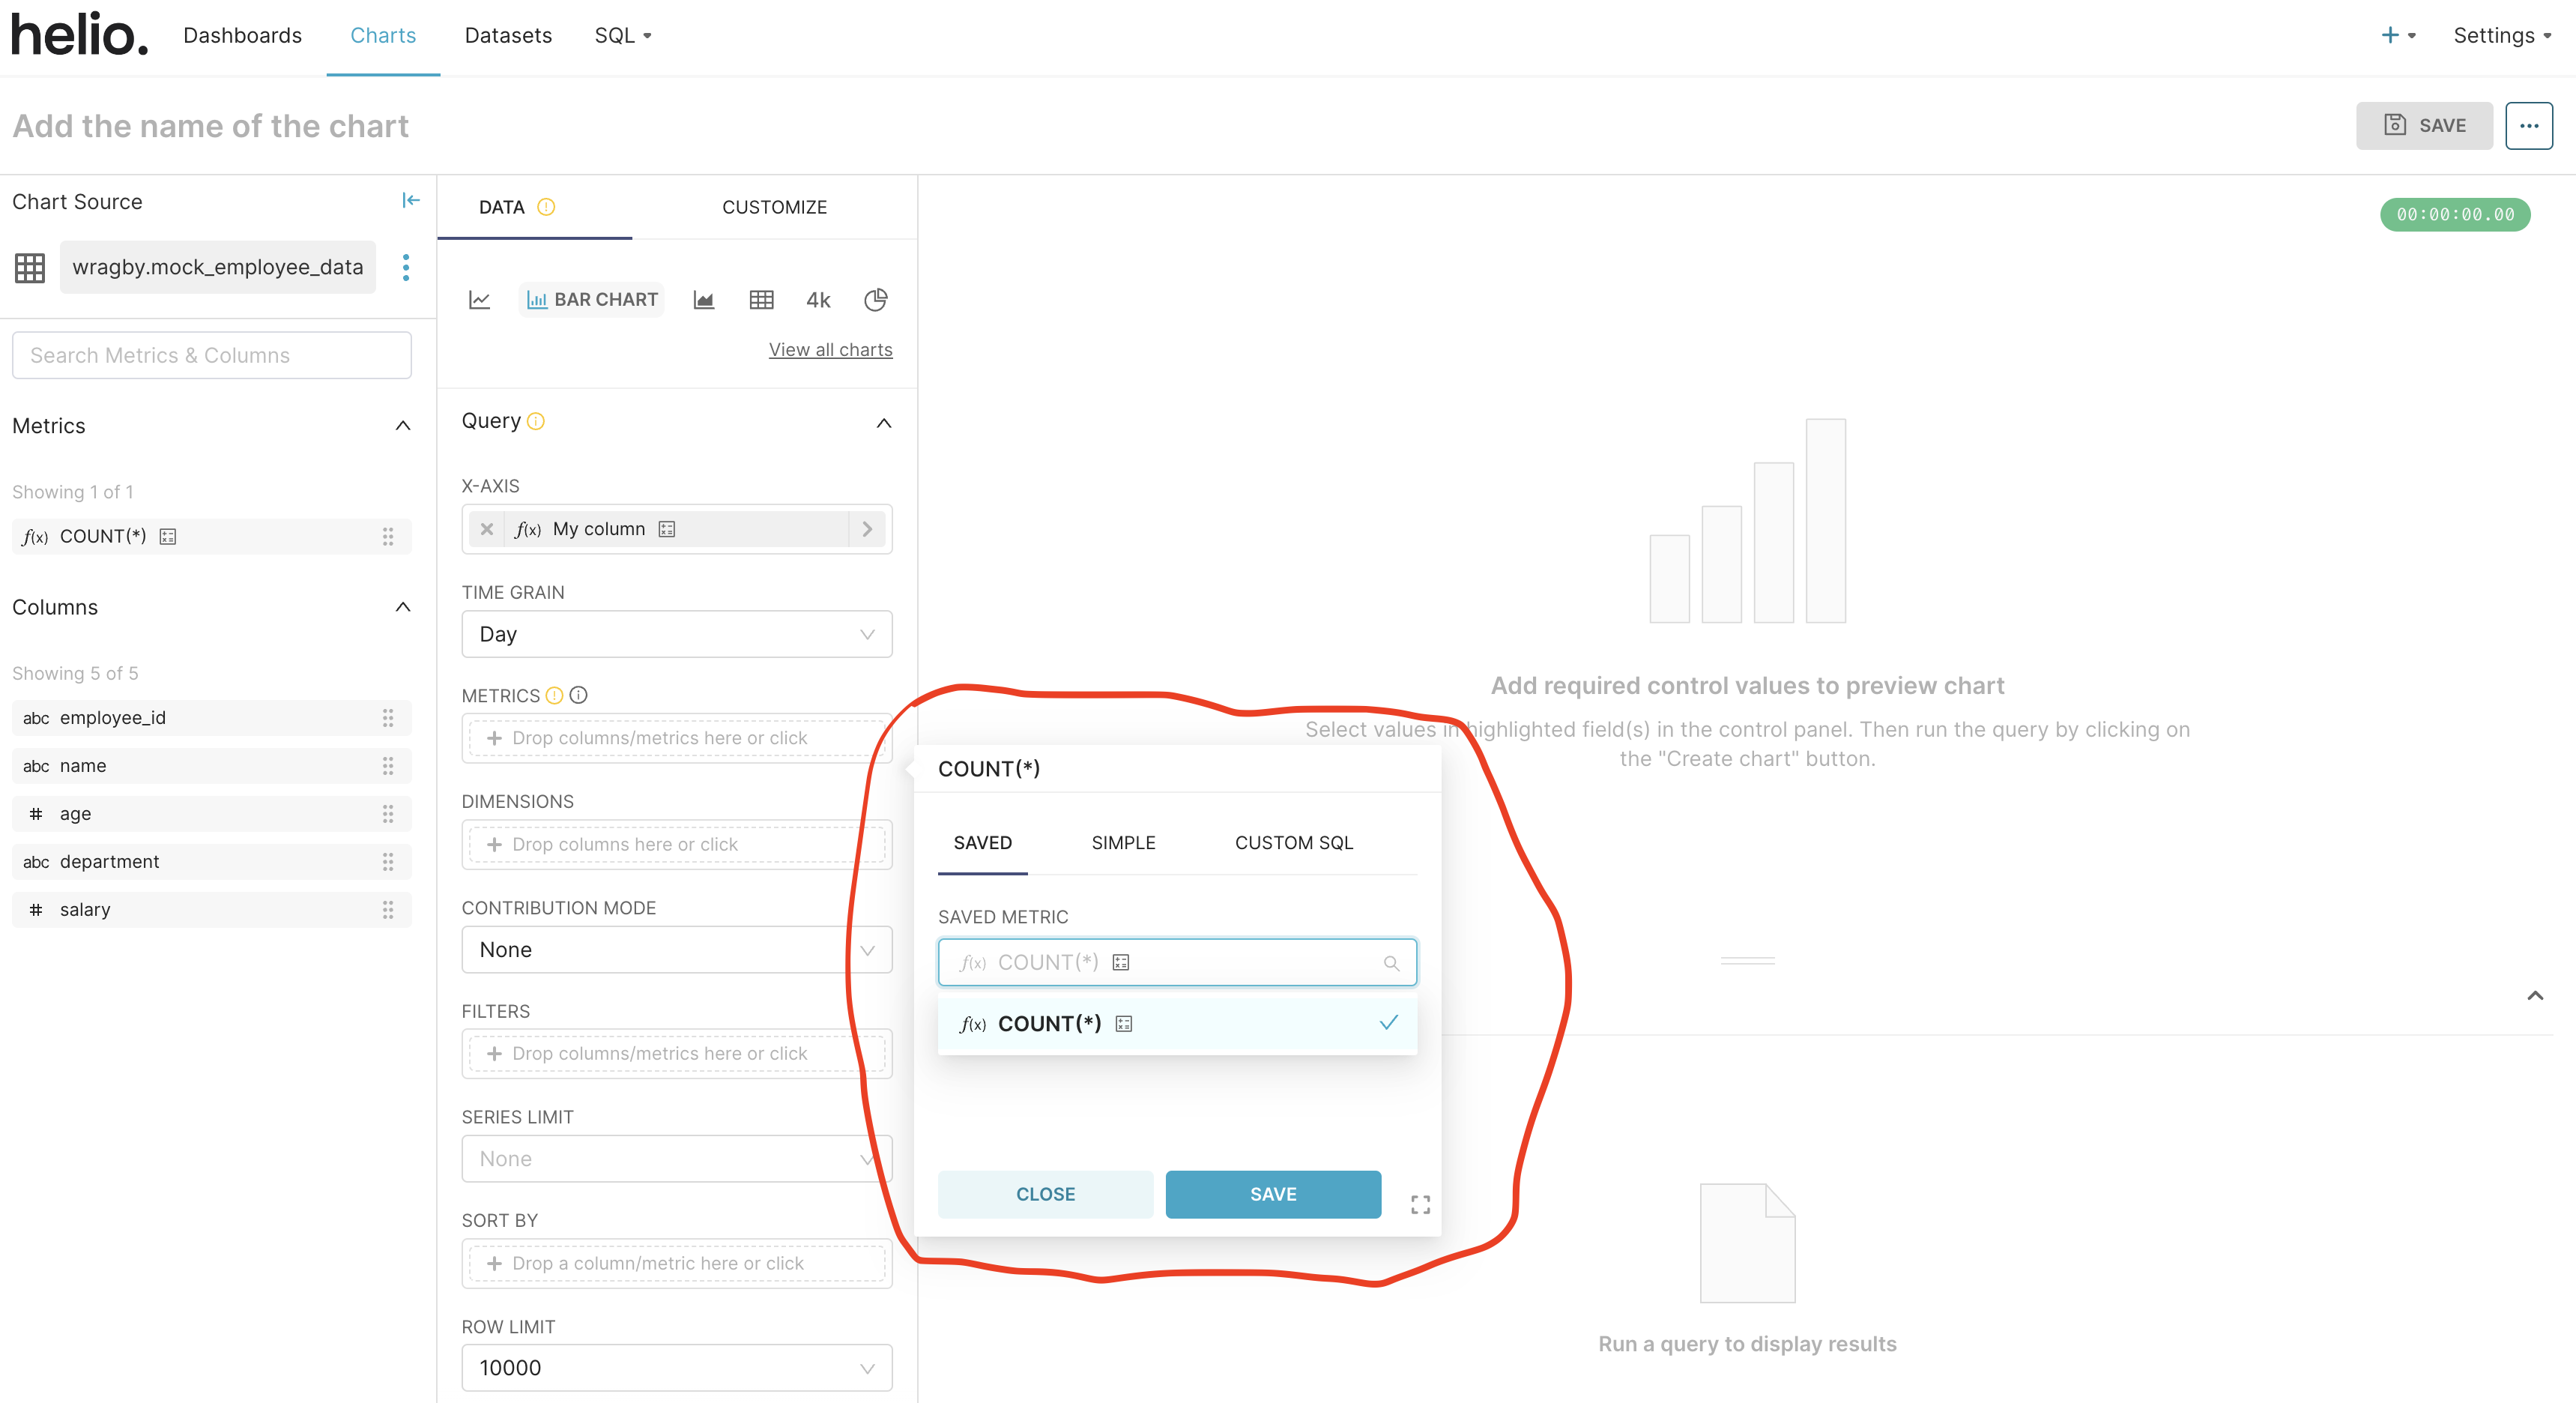
Select Data Column and Metrics
Select and configure data for the x-axis and metrics, ensuring your visualizations accurately represent your data. Choose your metrics and save.
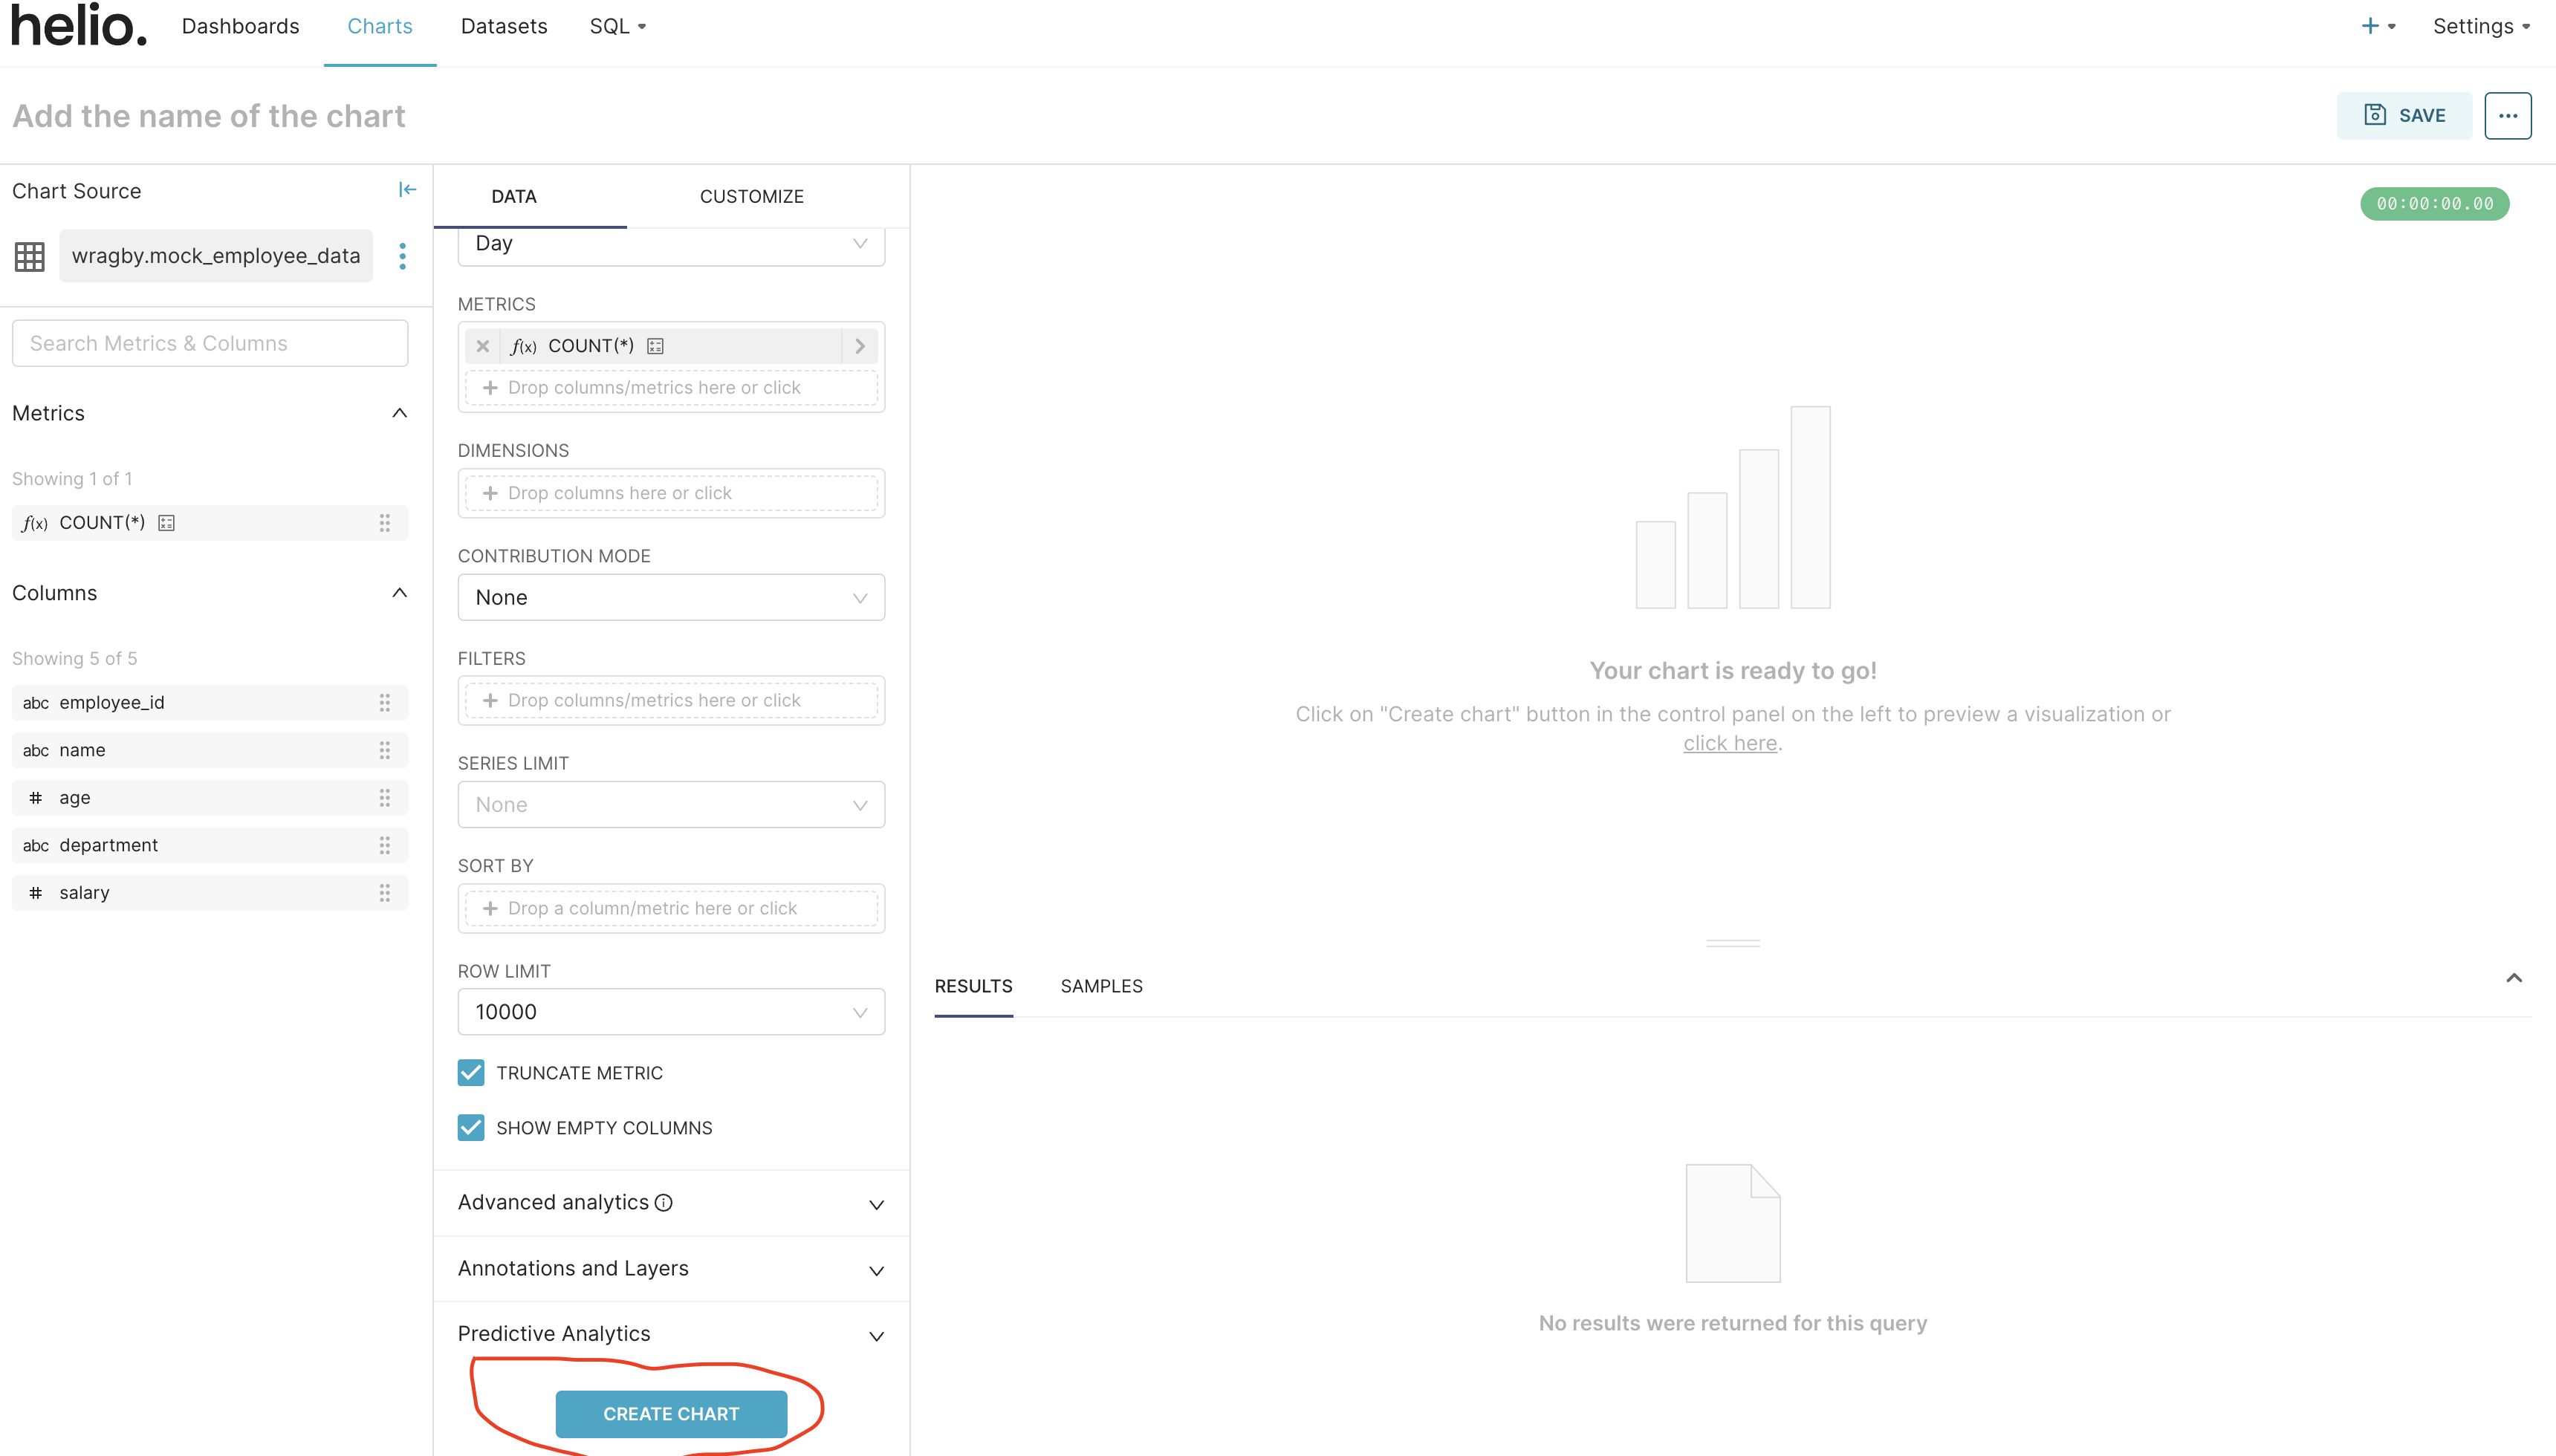
Visualize and Complete the Chart Creation
Click the “CREATE CHART” button at the bottom of the page to visualize your new chart.
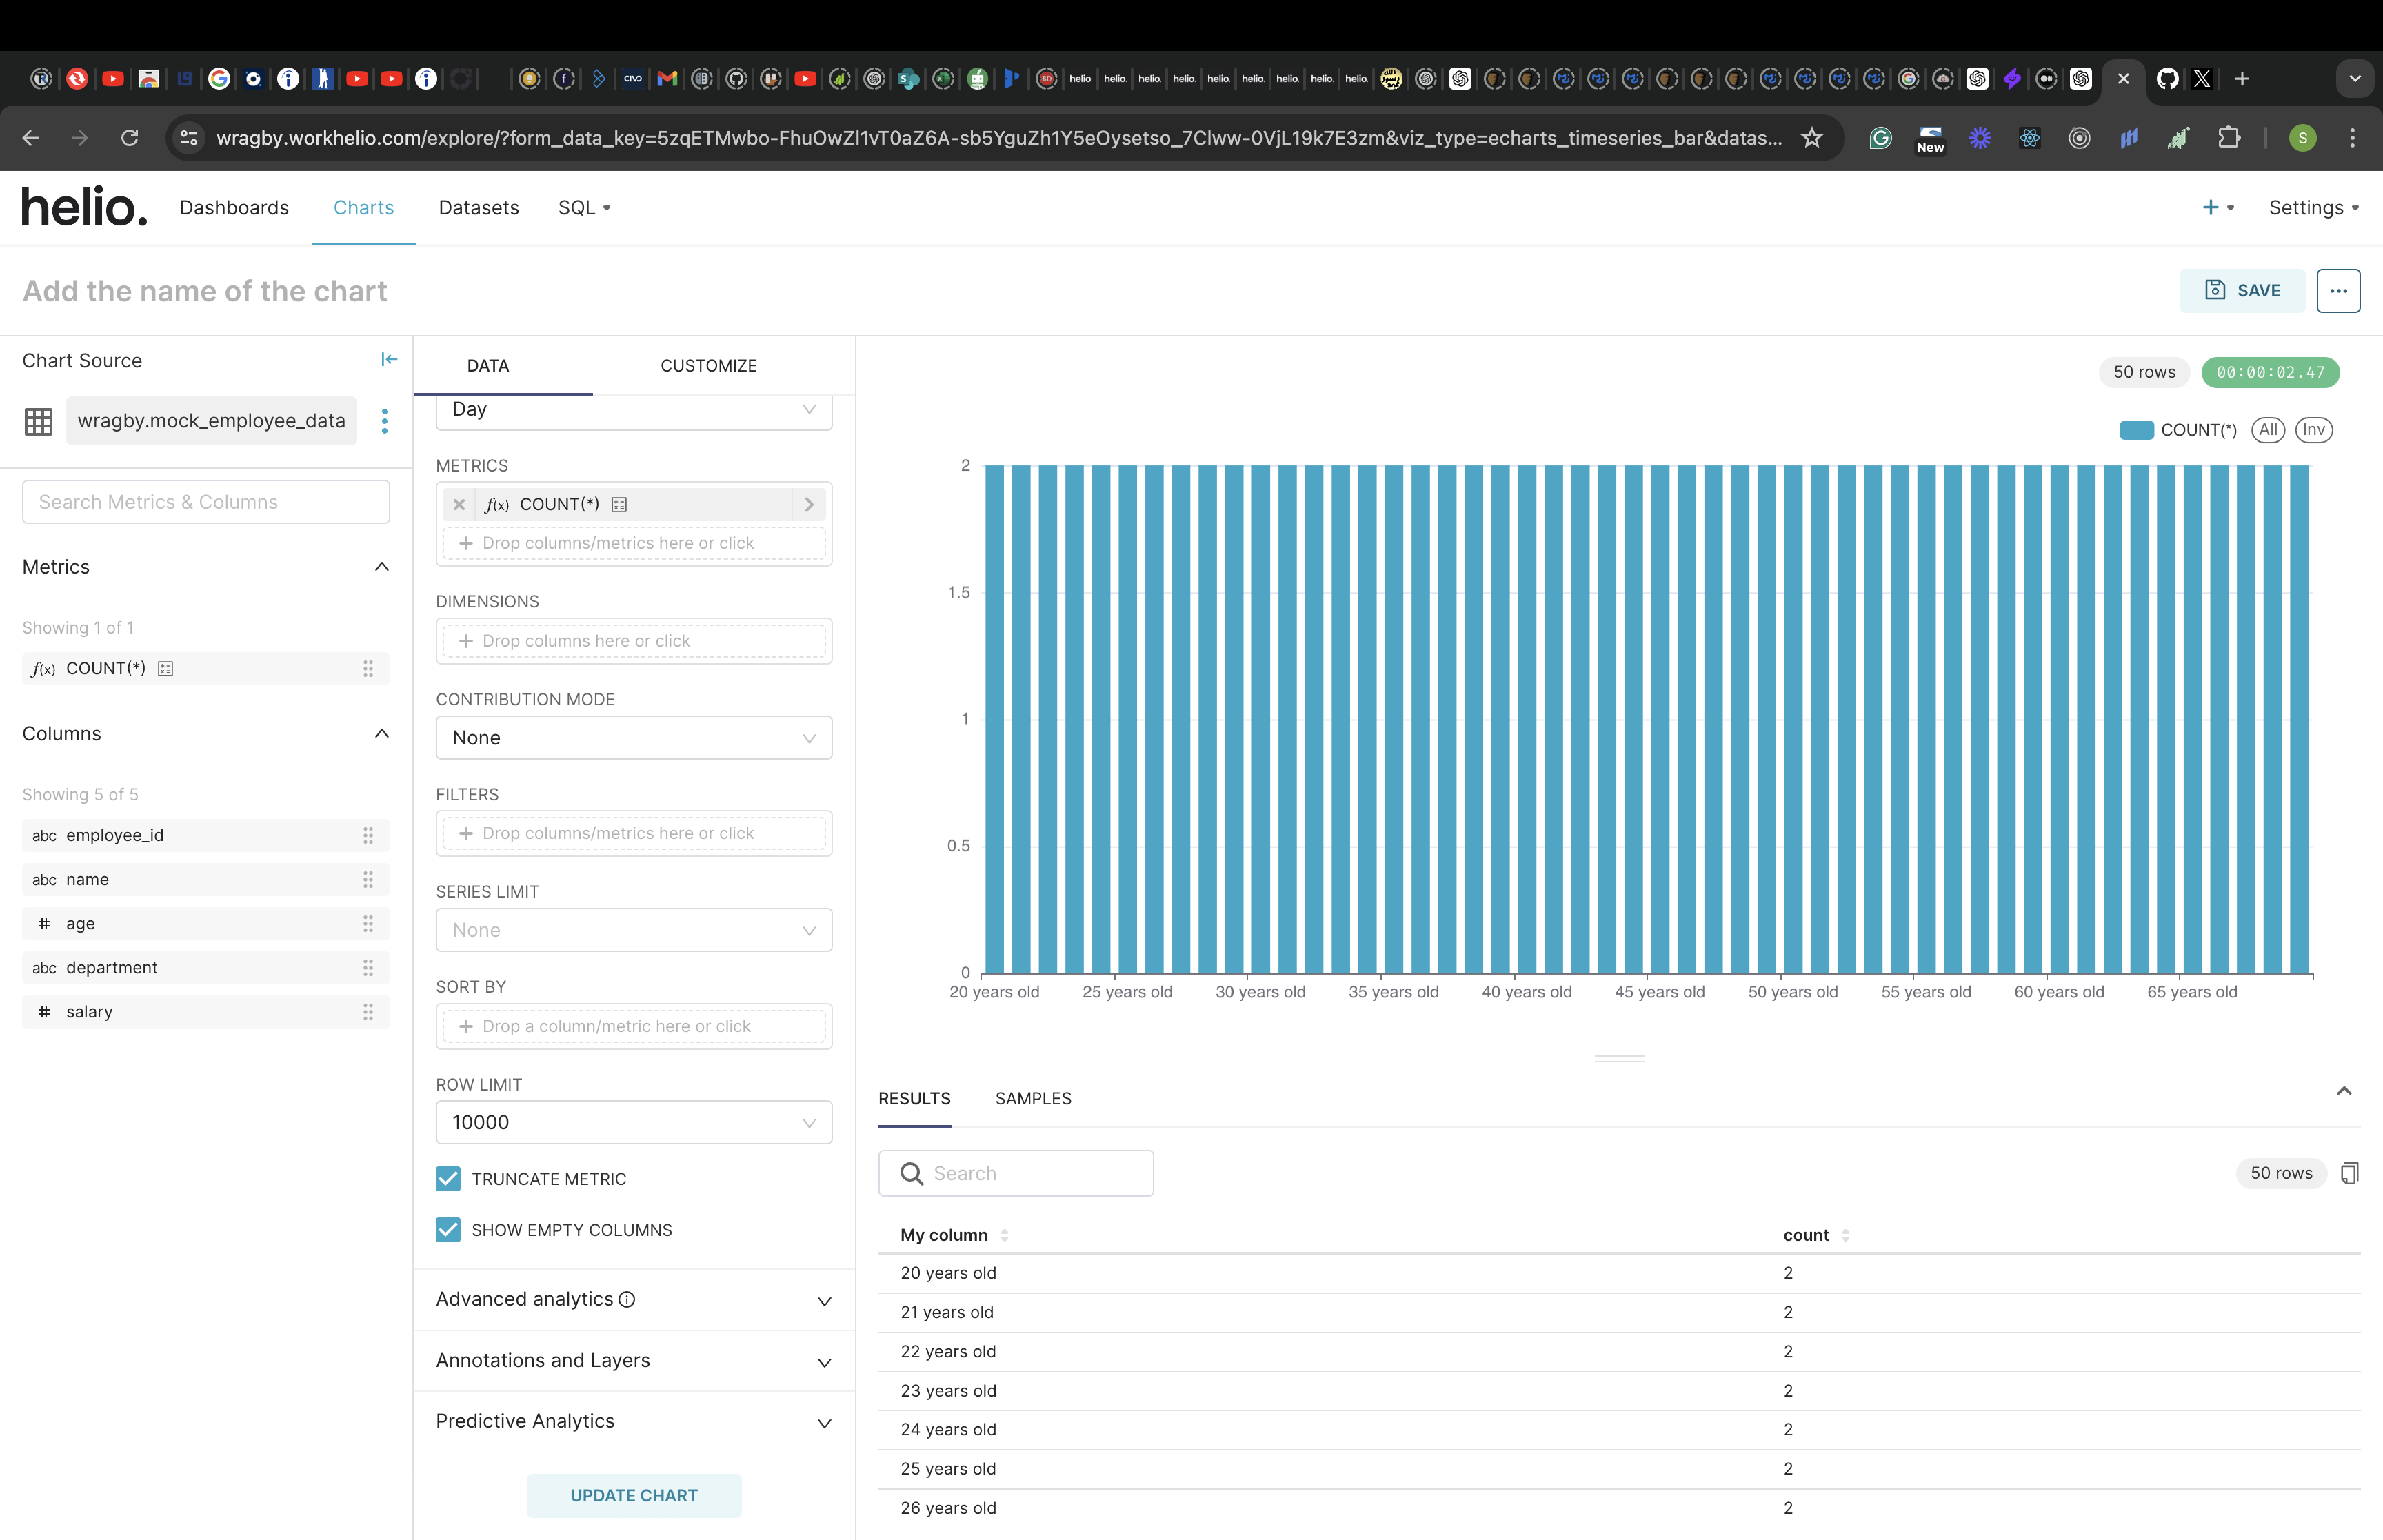
On the top-left of the page, add the name of the chart and click on the “SAVE” button at the top-right of the screen.
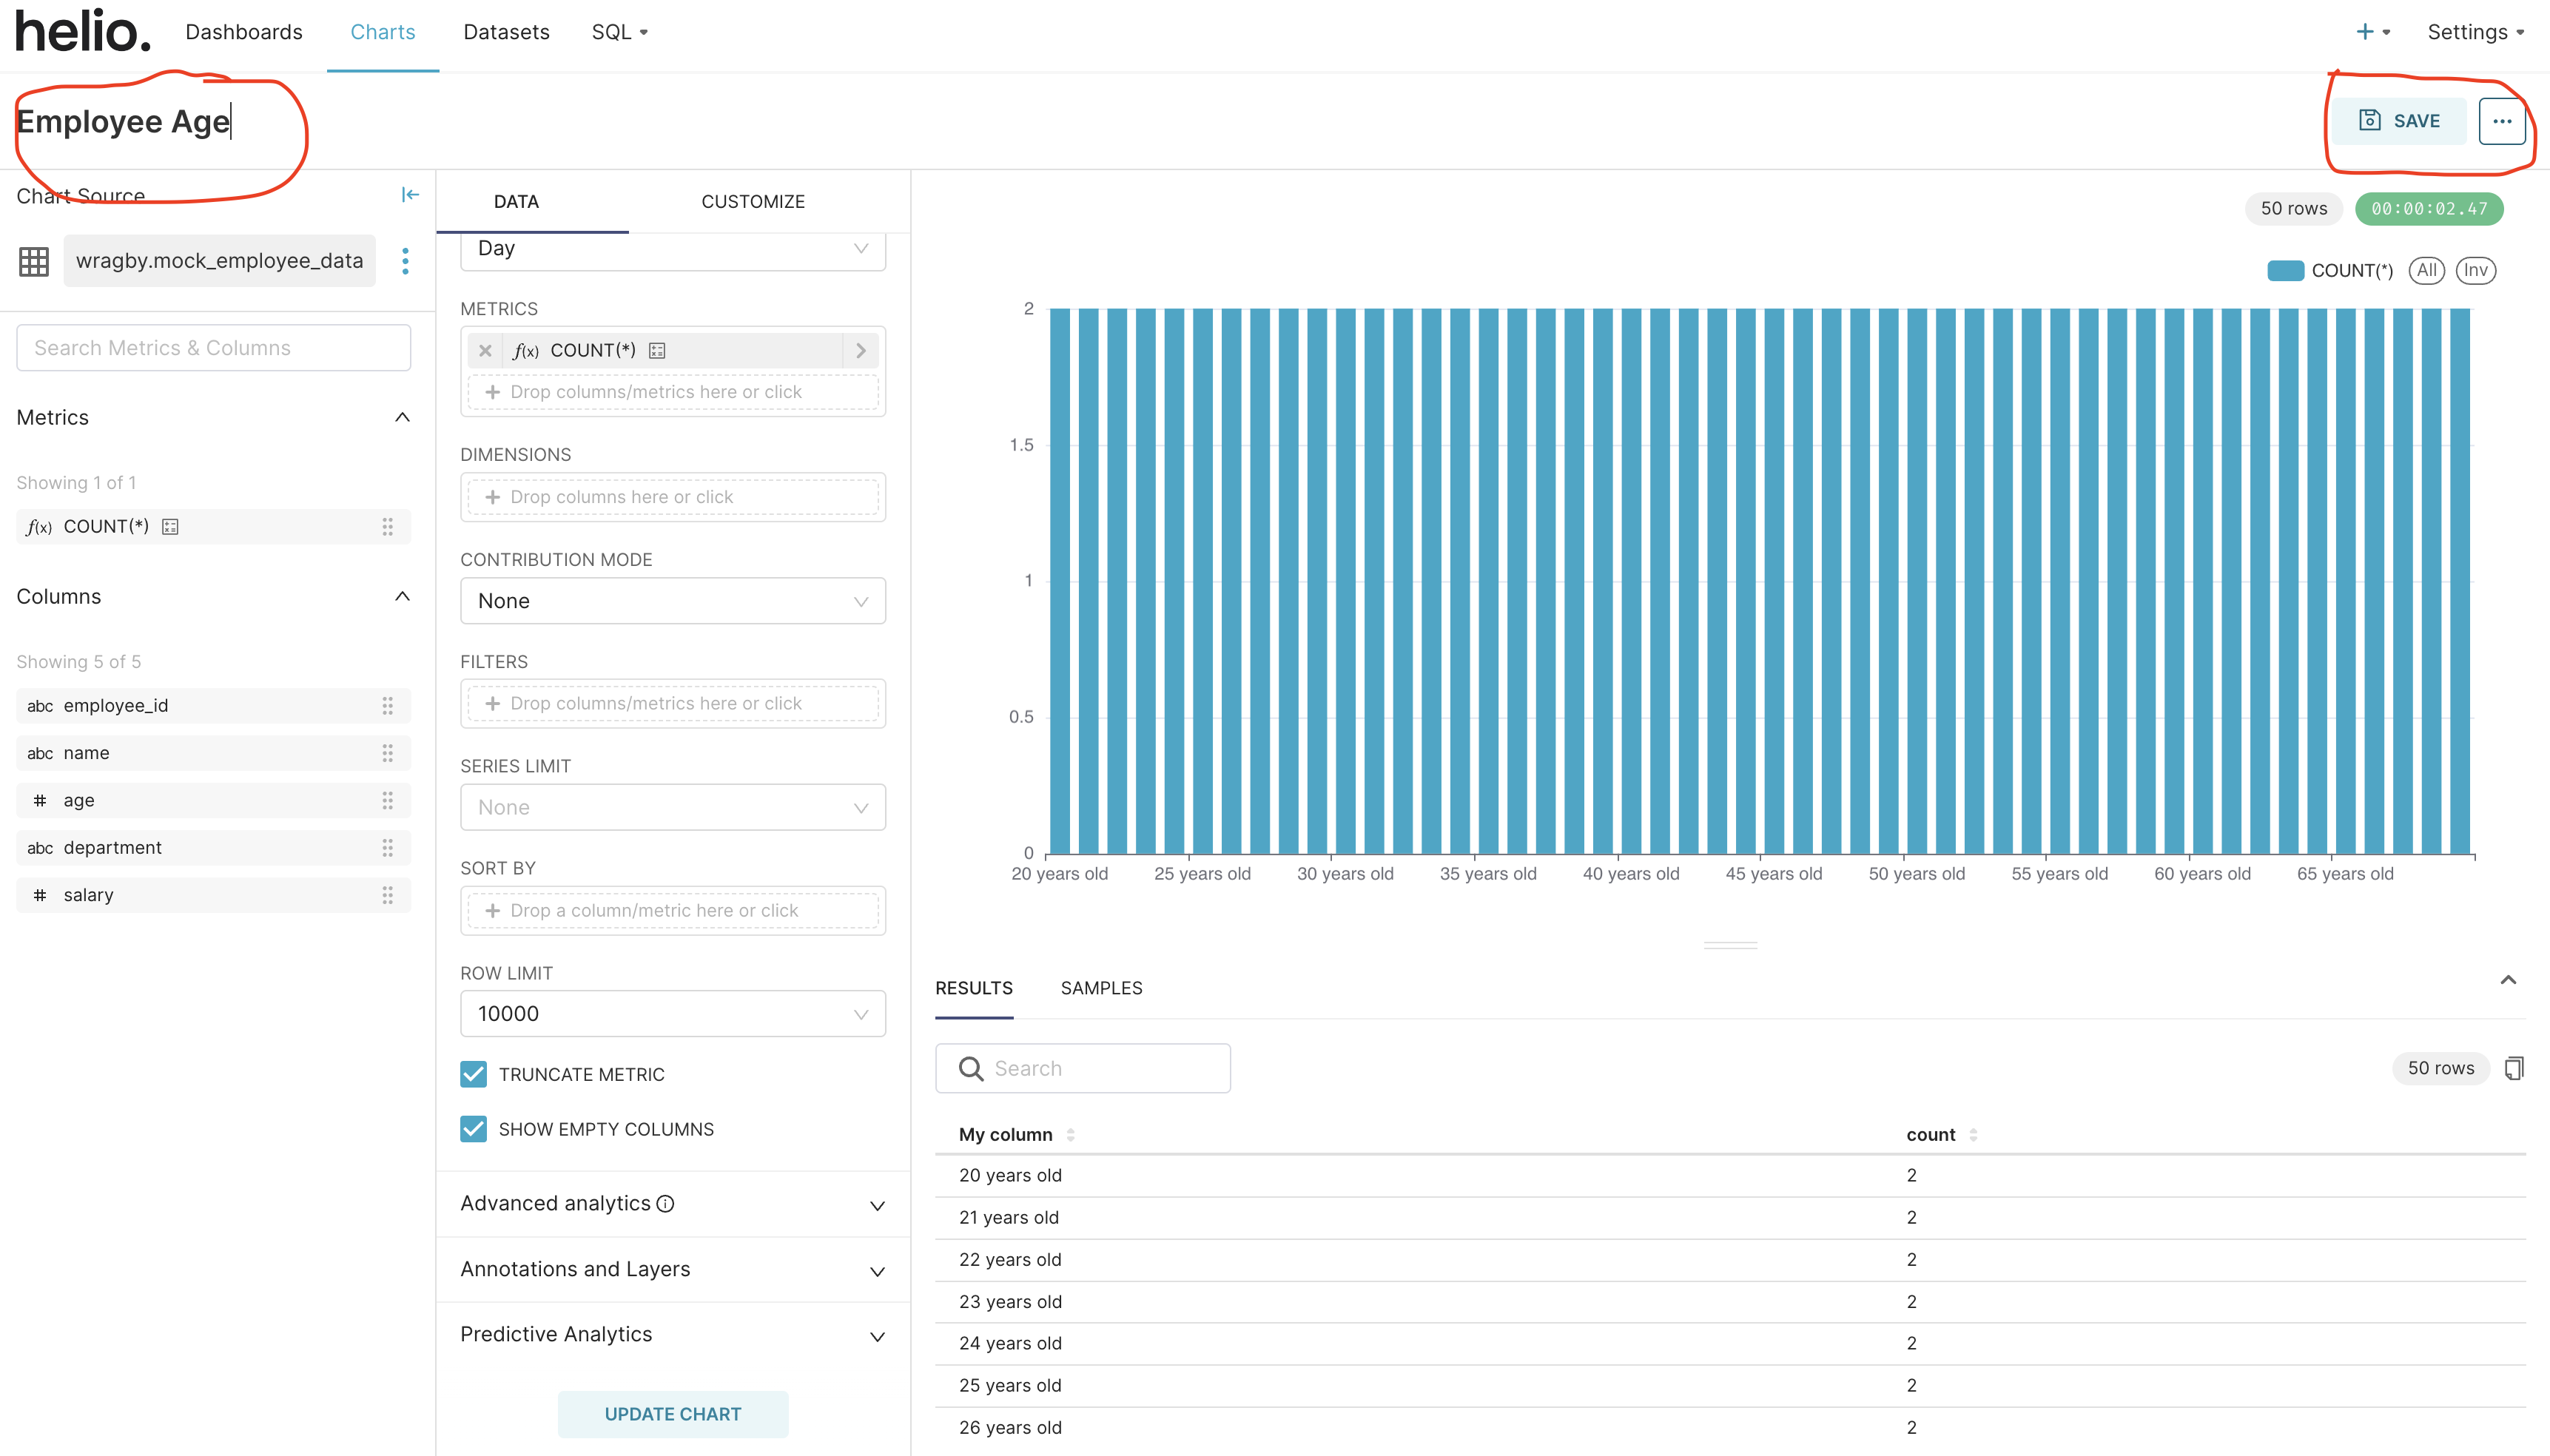
The save button opens a save modal where you can complete your chart creation.
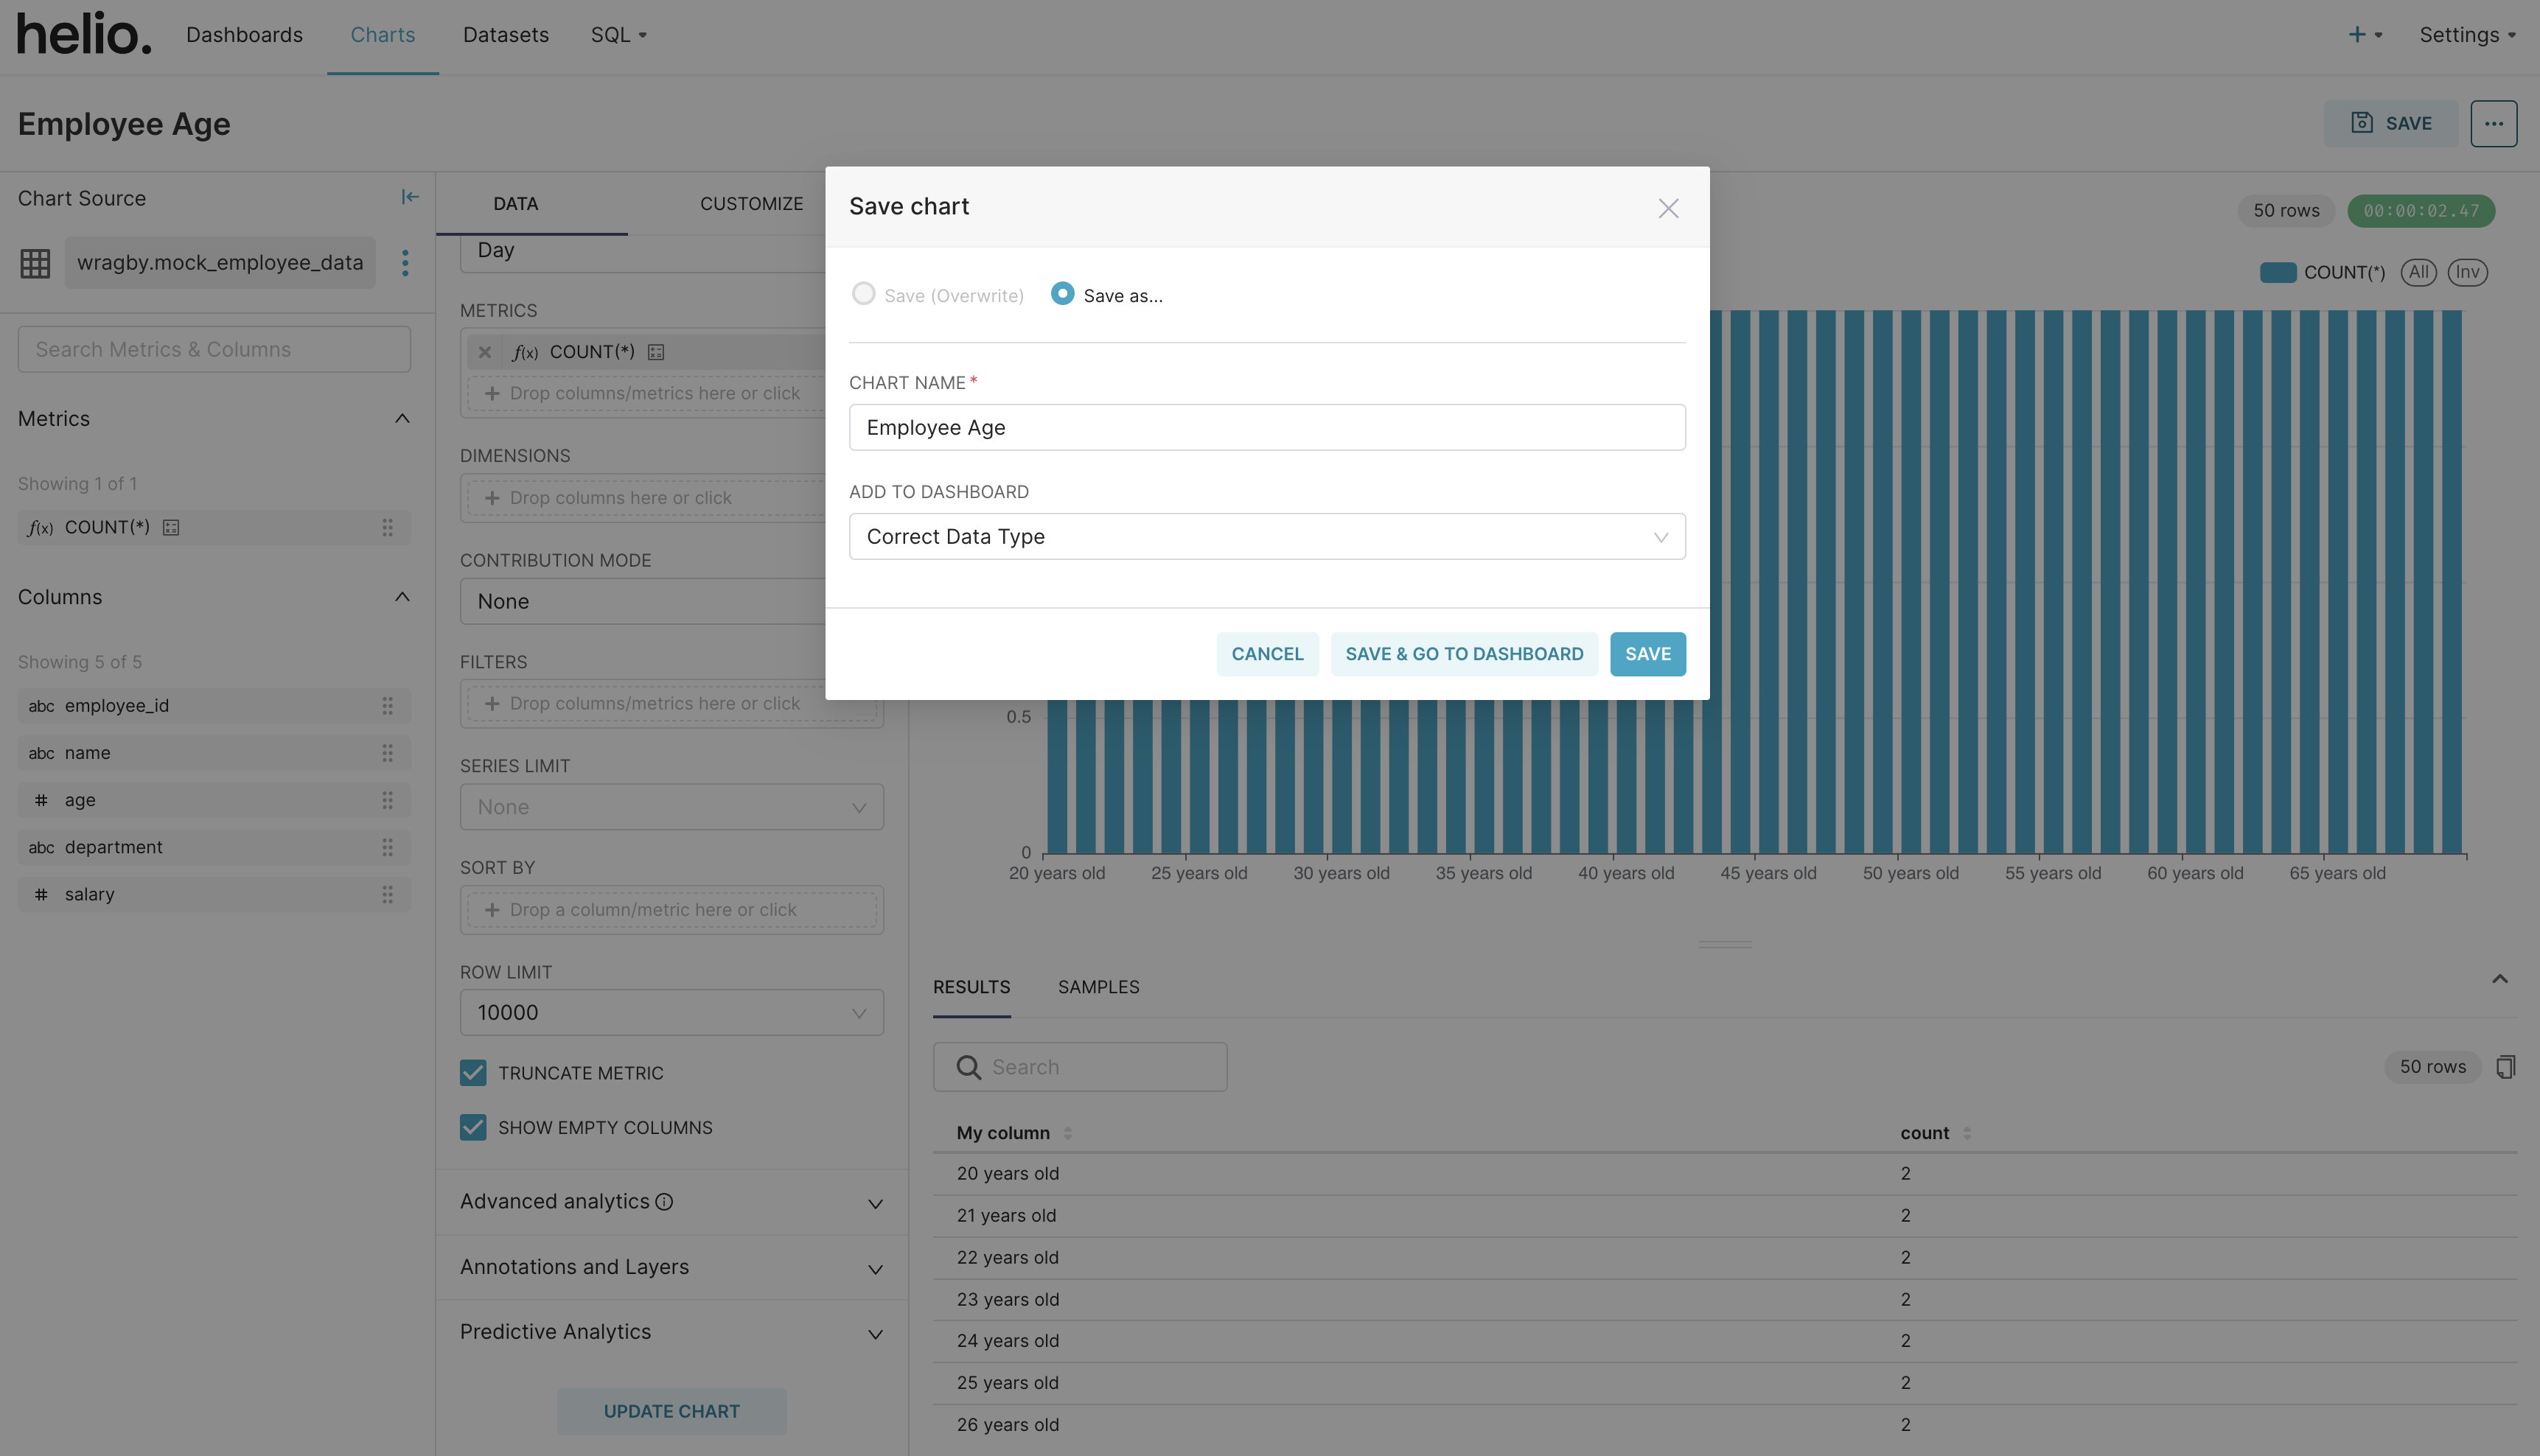
Congratulations! You have successfully launched the Workhelio app and created a chart.